
Spatiotemporal Characteristics and Influencing Factors of Digital Information Consumption Level
Received date: 2024-03-19
Revised date: 2024-09-03
Online published: 2024-11-29
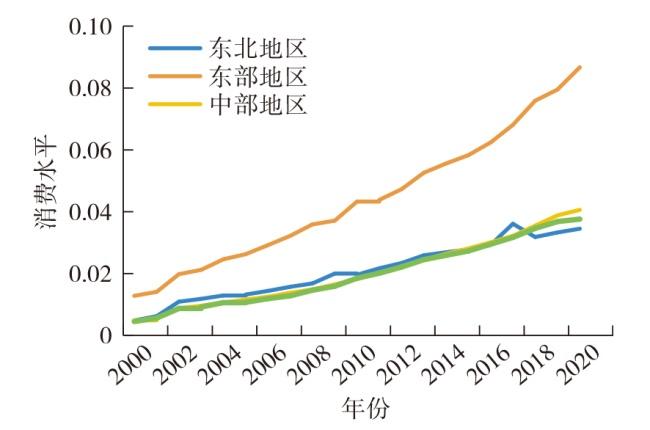
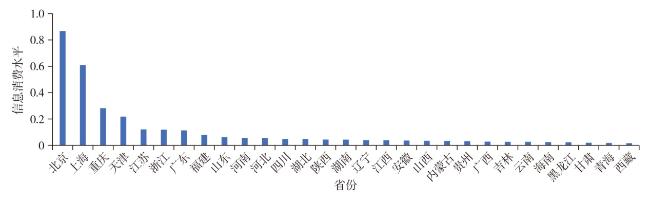
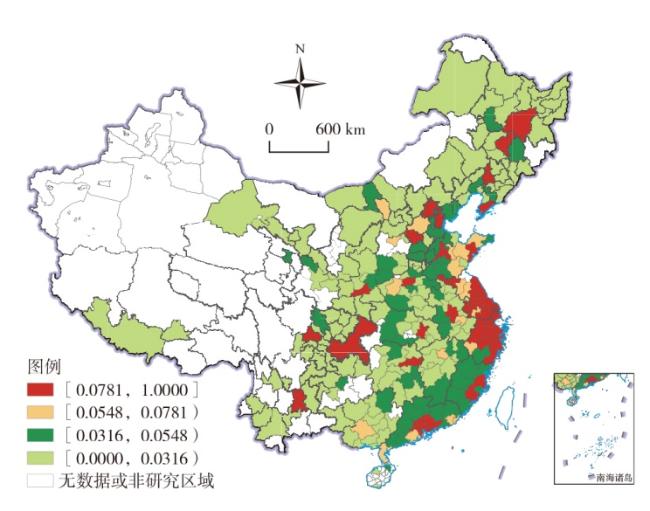
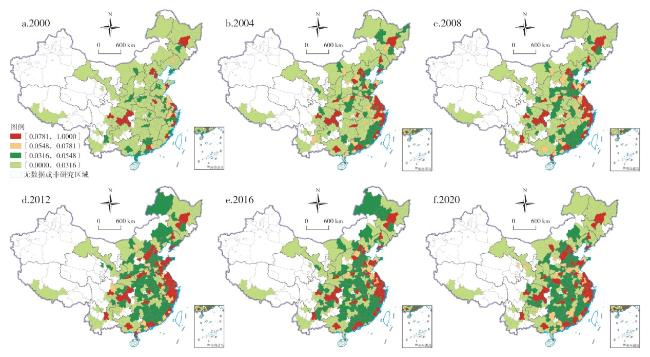
Utilizing the panel data of 278 prefecture-level cities in China from 2000 to 2020,this paper constructs a comprehensive measurement system for the digital information consumption level. Employing the entropy weight method,GIS spatial analysis,and the spatial Durbin model, it investigates regional heterogeneity and evolutionary trends of digital information consumption level in China. The findings are as follows: 1) In 2000-2020,the level of digital information consumption in China has been steadily increasing,reflecting the significant promotion of the development and popularization of the Internet and mobile communication technology to digital information consumption. 2) Digital information consumption level in China exhibits significant spatial agglomeration.The level of digital information consumption in the Yangtze River Delta,Pearl River Delta,and Beijing-Tianjin-Hebei region has always been in a leading position in China. The central,western and northeast regions have showed a rapid catch-up trend in recent years. 3) The diffusion path of digital information consumption shows a trend of spreading from core cities to surrounding small and medium-sized cities,particularly in urban agglomerations,large cities,and provincial capitals. 4) The proportion of the tertiary industry,population density,GDP growth rate,and the number of cultural and educational facilities have a significant positive impact on digital information consumption and foster growth in neighboring areas through spatial spillover effects. To further promote the sustained growth and regional balance of digital information consumption in China,it proposes some suggestions that are increasing investment in information infrastructure,optimizing regional development strategies, vigorously developing cultural industries,enhancing information service innovation,supporting the digital transformation of the tertiary industry,and improving the policy system for digital information consumption to continuously unleash the growth potential of digital information consumption, narrow regional disparities,and inject new momentum into economic development and the life quality improvement of resident.
MAO Lulu . Spatiotemporal Characteristics and Influencing Factors of Digital Information Consumption Level[J]. Economic geography, 2024 , 44(10) : 145 -154 . DOI: 10.15957/j.cnki.jjdl.2024.10.015
表1 数字信息消费评价指标体系Tab.1 Evaluation index system of digital information consumption |
| 一级指标 | 二级指标 | 三级指标 | 单位 | 符号 |
|---|---|---|---|---|
| 数字信息消费供给侧 | 基础设施供给 | 本地电话年末用户数 | 万户 | phone |
| 移动电话年末用户数 | 万户 | mobile | ||
| 国际互联网用户数 | 户 | internet | ||
| 内容与服务供给 | 电信业务总量 | 万元 | teleinc | |
| 专利授权数 | 件 | patentsuc | ||
| 人力资本供给 | 文化、体育和娱乐业从业人员数(万人)的比值 | % | worksport | |
| 数字信息消费需求侧 | 消费能力 | 居民可支配收入 | 元 | DI |
| 消费素养 | 人均受教育年限 | 年 | perEDU |
表2 数字信息消费各指标描述性统计Tab.2 Descriptive statistics of indicators of digital information consumption |
| 指标 | 观测值 | 均值 | 标准差 | 最小值 | 最大值 |
|---|---|---|---|---|---|
| patentsuc | 5838 | 4193.136 | 11232.750 | 0.000 | 222412.000 |
| teleinc | 5838 | 358422.8 | 720292.5 | 4908.0 | 1.4000e7 |
| worksport | 5838 | 0.4895 | 1.3296 | 0.0150 | 41.1820 |
| phone | 5838 | 0.8828 | 3.8671 | 0.0150 | 85.9130 |
| mobile | 5838 | 312.6679 | 422.9465 | 0.2500 | 4287.000 |
| internet | 5838 | 662655.90 | 1280063.00 | 237.00 | 5.17e7 |
| DI | 5838 | 14514.47 | 10236.78 | 2269.21 | 72232.00 |
| perEDU | 5838 | 8.2630 | 1.4538 | 4.000 | 12.7008 |
表3 2000—2020年中国数字信息消费平均水平Tab.3 Average level of digital information consumption in China from 2000 to 2020 |
| 年份 | 平均值 | 年份 | 平均值 | 年份 | 平均值 | ||
|---|---|---|---|---|---|---|---|
| 2000 | 0.0259 | 2007 | 0.0525 | 2014 | 0.0578 | ||
| 2001 | 0.0290 | 2008 | 0.0514 | 2015 | 0.0588 | ||
| 2002 | 0.0490 | 2009 | 0.0537 | 2016 | 0.0603 | ||
| 2003 | 0.0495 | 2010 | 0.0464 | 2017 | 0.0604 | ||
| 2004 | 0.0530 | 2011 | 0.0546 | 2018 | 0.0612 | ||
| 2005 | 0.0539 | 2012 | 0.0563 | 2019 | 0.0627 | ||
| 2006 | 0.0575 | 2013 | 0.0574 | 2020 | 0.0642 |
表4 2000—2020年中国数字信息消费水平莫兰指数Tab.4 Moran index of digital information consumption level in China in 2000—2020 |
| 年份 | Moran's I | Z值 | 年份 | Moran's I | Z值 |
|---|---|---|---|---|---|
| 2000 | 0.011 | 3.629 | 2011 | 0.007 | 1.813 |
| 2001 | 0.010 | 3.004 | 2012 | 0.007 | 1.827 |
| 2002 | 0.008 | 2.435 | 2013 | 0.006 | 1.874 |
| 2003 | 0.008 | 2.307 | 2014 | 0.006 | 1.863 |
| 2004 | 0.008 | 2.118 | 2015 | 0.006 | 1.860 |
| 2005 | 0.008 | 2.200 | 2016 | 0.006 | 1.850 |
| 2006 | 0.008 | 2.262 | 2017 | 0.007 | 1.801 |
| 2007 | 0.008 | 2.433 | 2018 | 0.005 | 1.869 |
| 2008 | 0.008 | 2.073 | 2019 | 0.006 | 1.888 |
| 2009 | 0.007 | 1.918 | 2020 | 0.006 | 1.887 |
| 2010 | 0.007 | 1.570 |
表5 变量含义与描述性统计Tab.5 Variable meaning and descriptive statistics |
| 符号 | 指标名称(单位) | 观测值 | 均值 | 标准差 |
|---|---|---|---|---|
| Score | 数字信息消费综合指数 | 5838 | 0.0531 | 0.0803 |
| r_addvtert | 第三产业增加值占GDP比重(%) | 5838 | 38.8828 | 9.3701 |
| density | 人口密度(人/km2) | 5838 | 432.3169 | 327.6107 |
| gdpgrow | GDP增长率(%) | 5838 | 10.5892 | 5.0717 |
| museum | 博物馆数(个) | 5838 | 15.3816 | 20.0105 |
| r_libbook | 每百人公共图书馆藏书(册、件/百人) | 5838 | 54.0469 | 199.5391 |
| theater | 剧场、影剧院数(个) | 5838 | 17.7392 | 45.7694 |
表6 空间杜宾模型回归结果分析Tab.6 Regression results of spatial Durbin model |
| 变量名称 | (1) | (2) | (3) | (4) |
|---|---|---|---|---|
| r_addvtert | 0.014300*** | 0.044600*** | 0.006730*** | 0.010800*** |
| (6.14) | (5.56) | (4.37) | (4.27) | |
| density | 0.045000*** | 0.083000*** | 0.022900*** | 0.047300*** |
| (16.40) | (10.21) | (11.41) | (13.96) | |
| gdpgrow | 0.003260*** | 0.013400*** | 0.001310** | -0.000398 |
| (4.29) | (4.73) | (2.65) | (-0.46) | |
| museum | 0.009090*** | 0.017400*** | 0.003600*** | 0.005370*** |
| (6.29) | (4.83) | (3.34) | (3.76) | |
| r_libbook | 0.005960*** | 0.003370 | 0.006300*** | -0.000988 |
| (7.75) | (1.87) | (10.09) | (-1.18) | |
| theater | 0.000408 | 0.001870 | -0.000388 | 0.002280*** |
| (0.74) | (1.41) | (-0.90) | (4.35) | |
| cons | -0.308000*** | -0.684000*** | -0.149000*** | -0.508000* |
| (-17.53) | (-12.26) | (-11.89) | (-2.55) | |
| W·r_addvtert | -0.004820 | |||
| (-0.50) | ||||
| W·density | 0.042000*** | |||
| (4.22) | ||||
| W·gdpgrow | 0.002000*** | |||
| (3.15) | ||||
| W·museum | -0.003890 | |||
| (-0.32) | ||||
| W·r_libbook | -0.003570 | |||
| (-0.70) | ||||
| W·theater | -0.003650 | |||
| (-0.53) | ||||
| r2 | 0.1990 | 0.1990 | 0.1990 | 0.2068 |
| N | 5838 | 1827 | 4011 | 5838 |
注:*、**、***分别表示10%、5%、1%显著性水平,括号内为t值。 |
| [1] |
习近平. 不断做强做优做大我国数字经济[J]. 求是, 2022(2):4-8.
|
| [2] |
徐宏潇. 习近平关于发展数字经济重要论述的生成脉络、内在逻辑与时代价值[J]. 经济学家, 2022(10):5-13.
|
| [3] |
韩鑫. 信息消费展现蓬勃生机[N]. 人民日报,2022-11-24(2).
|
| [4] |
隋岩. 群体传播时代:信息生产方式的变革与影响[J]. 中国社会科学, 2018(11):114-134.
|
| [5] |
|
| [6] |
|
| [7] |
崔建华. 信息消费力几个理论问题研究[J]. 消费经济, 2006(4):67-70.
|
| [8] |
何猛, 闫强. 大数据时代的信息消费内涵分析[J]. 北京邮电大学学报:社会科学版, 2014, 16(4):40-45.
|
| [9] |
朱红. 信息消费——理论、方法及水平测度[M]. 北京: 社会科学文献出版社, 2005.
|
| [10] |
郭妍, 张立光. 我国居民信息消费函数的实证研究[J]. 当代财经, 2007(8):16-19.
|
| [11] |
|
| [12] |
|
| [13] |
李俊杰, 周民良, 薛飞. 信息消费试点政策是否促进城市数字经济发展?——来自国家信息消费试点城市的证据[J]. 消费经济, 2023, 39(5):12-25.
|
| [14] |
沈小玲. 我国城镇居民信息消费问题研究[M]. 北京: 人民出版社, 2013.
|
| [15] |
柳思维, 杜蓉, 周洪洋. 金融发展、人力资本投入对农村居民信息消费影响[J]. 经济地理, 2019, 39(12):168-177.
|
| [16] |
李婵娟, 王子敏, 马万里. 农村居民信息消费省际差异的影响因素与贡献测度——基于Shapley值过程的实证分析[J]. 情报科学, 2017, 35(8):146-152.
|
| [17] |
许竹青, 郑风田, 陈洁. “数字鸿沟”还是“信息红利”?信息的有效供给与农民的销售价格——一个微观角度的实证研究[J]. 经济学(季刊), 2013, 12(4):1513-1536.
|
| [18] |
唐任伍, 武天鑫, 温馨. 数字技术赋能共同富裕实现的内在机理、深层逻辑和路径选择[J]. 首都经济贸易大学学报, 2022, 24(5):3-13.
|
| [19] |
裴淑媛. 数字信息消费及模式研究:基于沉浸体验视角[J]. 商业经济研究, 2021(18):37-41.
|
| [20] |
孙久文, 李承璋. 需求侧与供给侧结合的消费升级路径研究[J]. 中国人民大学学报, 2022, 36(2):52-62.
|
| [21] |
万建香, 刘琼芳, 王姗姗. 人工智能创新与居民消费:基于供需双侧路径分析[J/OL]. 系统工程理论与实践,1-25[2024-10-02].
|
| [22] |
张晨. 全球数字政府建设现状及非均衡分析[J]. 数量经济技术经济研究, 2022, 39(3):86-106.
|
| [23] |
杨俊, 李小明, 黄守军. 大数据、技术进步与经济增长——大数据作为生产要素的一个内生增长理论[J]. 经济研究, 2022, 57(4):103-119.
|
| [24] |
师博, 任保平. 中国省际经济高质量发展的测度与分析[J]. 经济问题, 2018(4):1-6.
|
| [25] |
陈建军, 陈国亮, 黄洁. 新经济地理学视角下的生产性服务业集聚及其影响因素研究——来自中国222个城市的经验证据[J]. 管理世界, 2009(4):83-95.
|
| [26] |
朱迪. “宏观结构”的隐身与重塑:一个消费分析框架[J]. 中国社会科学, 2023(3):26-46.
|
| [27] |
杨新铭. 数字经济:传统经济深度转型的经济学逻辑[J]. 深圳大学学报:人文社会科学版, 2017, 34(4):101-104.
|
| [28] |
李三希, 刘希, 豆江利. 全球数字经济三极格局:发展特征、重要举措与中国应对[J]. 经济纵横, 2024(5):107-119.
|
| [29] |
江小涓, 李辉. 服务业与中国经济:相关性和加快增长的潜力[J]. 经济研究, 2004(1):4-15.
|
| [30] |
方福前. 中国居民消费需求不足原因研究——基于中国城乡分省数据[J]. 中国社会科学, 2009(2):68-82,205-206.
|
| [31] |
欧阳峣, 傅元海, 王松. 居民消费的规模效应及其演变机制[J]. 经济研究, 2016, 51(2):56-68.
|
| [32] |
娄勤俭. 文化产业如何成为支柱性产业?[J]. 求是, 2013(15):42-44.
|
/
| 〈 |
|
〉 |