
Impact and Mechanism of China's Urban Network Position on Economic Growth from the Perspective of Multi-source Data
Received date: 2024-03-11
Revised date: 2024-06-16
Online published: 2024-11-29
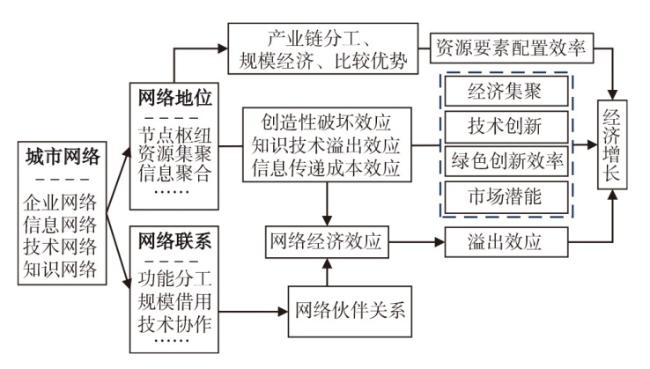
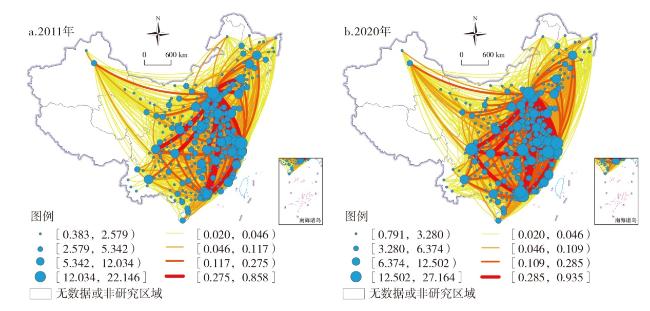
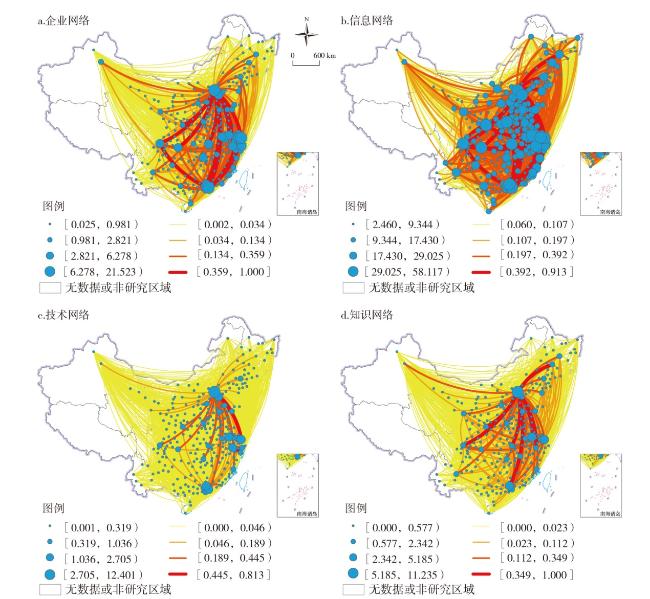
Based on the multi-source data of listed company headquarters and branches,co-publication papers,joint patent application and Baidu Index,this paper constructs aggregated network and categorized network among 286 cities at or above the prefecture level in China from 2011 to 2020. It uses the social network analysis method and spatial econometric model to empirically analyze the impact and mechanism of China's urban network position on economic growth. The results show that: 1) China's urban network exhibits significant spatial directionality,regions with higher urban network position and linkage strengths mainly distributed among the diamond-shaped structure composed of the Beijing-Tianjin-Hebei,Yangtze River Delta,Pearl River Delta and Chengdu-Chongqing urban agglomerations. There is also categorical heterogeneity in corporate network,information network,technology network and knowledge network. 2) The enhancement of urban network position and partner network position can promote economic growth. Economic agglomeration,technological innovation,green innovation efficiency and market potential are all important impact factors of urban network position on economic growth. 3) The impacts of urban network position on economic growth has regional heterogeneity in terms of location condition,size level and environmental quality,as well as categorical heterogeneity in different types of networks such as corporate network,information network,technology network and knowledge network.
ZHOU Honghao , GU Guofeng , REN Huimin . Impact and Mechanism of China's Urban Network Position on Economic Growth from the Perspective of Multi-source Data[J]. Economic geography, 2024 , 44(10) : 55 -65 . DOI: 10.15957/j.cnki.jjdl.2024.10.006
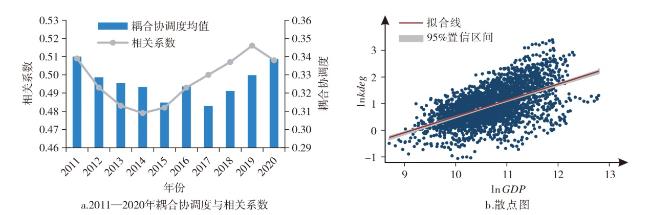
图4 中国城市网络地位与经济增长的耦合协调度、相关系数与散点图Fig.4 Coupling coordination degree,correlation coefficient and scatter plots between China's urban network position and economic growth |
表1 空间效应检验Tab.1 Test of spatial effects |
| 统计量 | W | Wd | Wq | Wi |
|---|---|---|---|---|
| Moran's I | 142.535*** | 57.355*** | 34.827*** | 46.466*** |
| LM lag | 9193.974*** | 1697.154*** | 999.241*** | 0.024 |
| Robust LM lag | 319.395*** | 64.666*** | 109.265*** | 30.931*** |
| LM error | 1.7e+04*** | 3212.217*** | 1199.460*** | 2040.257*** |
| Robust LM error | 8493.778*** | 1579.729*** | 309.485*** | 2071.164*** |
| LR spatial | 242.19*** | 75.74*** | 723.57*** | 2182.04*** |
| LR time | 11484.82*** | 12016.78*** | 11727.33*** | 12280.74*** |
| 控制变量 | 是 | 是 | 是 | 是 |
注:***表示1%的显著性水平。 |
表2 空间杜宾模型估计Tab.2 Estimation of spatial Durbin model |
| 变量与统计量 | W | Wd | Wq | Wi |
|---|---|---|---|---|
| kn | 0.073*** | 0.055*** | 0.064*** | 0.058*** |
| (0.007) | (0.007) | (0.007) | (0.007) | |
| W·kn | 0.433*** | 0.082*** | 0.041*** | 0.032*** |
| (0.109) | (0.026) | (0.013) | (0.015) | |
| LR lag | 418.43*** | 80.02*** | 76.95*** | 76.89*** |
| LR error | 545.46*** | 158.95*** | 274.31*** | 170.29*** |
| Hausman | 612.46*** | 64.68*** | 182.79*** | 145.96*** |
| R2 | 0.077 | 0.330 | 0.142 | 0.046 |
| N | 2860 | 2860 | 2860 | 2860 |
| 控制变量 | 是 | 是 | 是 | 是 |
注:***表示1%的显著性水平;括号中数字表示对应的标准误。 |
表3 稳健性与内生性分析Tab.3 Robustness and endogenous analysis |
| 变量 | (1) viirs | (2) eg | (3) eg | (4) eg | (5) eg | (6) kn | (7) eg | (8) eg |
|---|---|---|---|---|---|---|---|---|
| kn | 0.159***(0.046) | 0.072***(0.008) | 0.085***(0.008) | 0.085***(0.008) | 0.226*(1.828) | 0.106***(12.308) | ||
| W·kn | 4.964***(0.669) | 0.503***(0.107) | 0.748***(0.119) | 0.455***(0.113) | ||||
| keig | 0.084***(0.009) | |||||||
| W·keig | 0.488***(0.128) | |||||||
| yz | 0.025***(3.650) | 0.003(0.997) | ||||||
| 控制变量 | 是 | 是 | 是 | 是 | 是 | 是 | 是 | 是 |
| LM test | 13.344*** | |||||||
| Wald test | 13.325*** |
表4 基于SDM模型的作用机制分析Tab.4 Mechanism analysis of spatial Durbin model |
| 变量 | (1) jj | (2) eg | (3) js | (4) eg | (5) gge | (6) eg | (7) mp | (8) eg |
|---|---|---|---|---|---|---|---|---|
| kn | 0.133***(0.013) | 0.021***(0.006) | 0.417***(0.060) | 0.068***(0.008) | 0.180***(0.059) | 0.069***(0.007) | 0.011***(0.002) | 0.054***(0.007) |
| W·kn | 0.550***(0.186) | 0.099(0.085) | 4.579***(0.875) | 0.357***(0.109) | 1.742**(0.862) | 0.469***(0.109) | 0.240***(0.036) | -0.013(0.102) |
| jj | 0.331***(0.009) | |||||||
| W·jj | 2.310***(0.184) | |||||||
| js | 0.008***(0.002) | |||||||
| W·js | 0.101**(0.044) | |||||||
| gge | 0.009***(0.002) | |||||||
| W·gge | 0.217***(0.048) | |||||||
| mp | 0.853***(0.063) | |||||||
| W·mp | 3.992***(0.528) | |||||||
| 控制变量 | 是 | 是 | 是 | 是 | 是 | 是 | 是 | 是 |
表5 不同区域的异质性分析Tab.5 Heterogeneity analysis of different regions |
| 变量 | (1) 区位条件 | (2) 规模等级 | (3) 环境质量 | |||||
|---|---|---|---|---|---|---|---|---|
| 区位条件好 | 区位条件差 | 大城市 | 中小城市 | 环境质量好 | 环境质量差 | |||
| kn | 0.094***(0.010) | 0.038***(0.010) | 0.078***(0.015) | 0.063***(0.009) | 0.096***(0.011) | 0.021**(0.009) | ||
| W·kn | 0.740***(0.164) | -0.002(0.101) | 0.502(0.319) | 0.404***(0.102) | 0.625***(0.138) | -0.455***(0.109) | ||
| 控制变量 | 是 | 是 | 是 | 是 | 是 | 是 | ||
注:区位条件依据各城市质心到海岸线距离平均值划分;规模等级根据2014年《国务院关于调整城市规模划分标准的通知》的划分标准,将第七次人口普查中城区常住人口大于100万的定义为大城市,其他则为中小城市;环境质量根据PM2.5年均浓度的平均值划分。 |
表6 城市网络分类异质性分析Tab.6 Categorical heterogeneity analysis of urban network |
| 变量 | (1) corp | (2) info | (3) pat | (4) wos | (5) lwos |
|---|---|---|---|---|---|
| Z | 0.007* | 0.078*** | 0.022** | -0.003 | 0.073*** |
| (0.004) | (0.008) | (0.010) | (0.008) | (0.026) | |
| W·Z | 0.265*** | 0.355*** | -0.579*** | -0.030 | -0.778*** |
| (0.096) | (0.113) | (0.102) | (0.087) | (0.274) | |
| 控制变量 | 是 | 是 | 是 | 是 | 是 |
注:corp、info、pat和wos分别表示企业、信息、技术和知识网络的估计结果;lwos为知识网络加权度数中心性滞后两期的估计结果;Z和W·Z表示不同类型城市网络地位及其空间滞后项。 |
| [1] |
刘承良, 管明明, 段德忠. 中国城际技术转移网络的空间格局及影响因素[J]. 地理学报, 2018, 73(8):1462-1477.
|
| [2] |
周锐波, 邱奕锋, 胡耀宗. 中国城市创新网络演化特征及多维邻近性机制[J]. 经济地理, 2021, 41(5):1-10.
|
| [3] |
戴靓, 纪宇凡, 王嵩, 等. 中国城市知识创新网络的演化特征及其邻近性机制[J]. 资源科学, 2022, 44(7):1494-1505.
|
| [4] |
王腾飞. 区域经济发展的知识动力及其多区位机制[J]. 地理科学进展, 2023, 42(4):782-795.
|
| [5] |
马海涛. 知识流动空间的城市关系建构与创新网络模拟[J]. 地理学报, 2020, 75(4):708-721.
|
| [6] |
安頔, 胡映洁, 万勇. 中国城市网络关联与经济增长溢出效应——基于大数据与网络分析方法的研究[J]. 地理研究, 2022, 41(9):2465-2481.
|
| [7] |
程玉鸿, 苏小敏. 城市网络外部性研究述评[J]. 地理科学进展, 2021, 40(4):713-720.
|
| [8] |
李丹丹, 汪涛, 周辉. 基于不同时空尺度的知识溢出网络结构特征研究[J]. 地理科学, 2013, 33(10):1180-1187.
|
| [9] |
周宏浩, 谷国锋. 外部性视角下中国城市网络演化及其环境效应研究[J]. 地理研究, 2022, 41(1):268-285.
|
| [10] |
|
| [11] |
盛科荣, 张杰, 张红霞. 上市公司500强企业网络嵌入对中国城市经济增长的影响[J]. 地理学报, 2021, 76(4):818-834.
|
| [12] |
曹湛, 戴靓, 吴康, 等. 全球城市知识合作网络演化的结构特征与驱动因素[J]. 地理研究, 2022, 41(4):1072-1091.
|
| [13] |
王腾飞, 谷人旭, 马仁锋, 等. “集聚—扩散”视角下中国区域创新极及其知识溢出区位[J]. 经济地理, 2021, 41(5):11-18,185.
|
| [14] |
戴靓, 曹湛, 朱青, 等. 中国城市群知识多中心发展评价[J]. 资源科学, 2021, 43(5):886-897.
|
| [15] |
李丹丹, 汪涛, 魏也华, 等. 中国城市尺度科学知识网络与技术知识网络结构的时空复杂性[J]. 地理研究, 2015, 34(3):525-540.
|
| [16] |
周晓艳, 侯美玲, 李霄雯. 独角兽企业内部联系视角下中国城市创新网络空间结构研究[J]. 地理科学进展, 2020, 39(10):1667-1676.
|
| [17] |
姚常成, 吴康. 集聚外部性、网络外部性与城市创新发展[J]. 地理研究, 2022, 41(9):2330-2349.
|
| [18] |
|
| [19] |
|
| [20] |
姚常成, 宋冬林. 借用规模、网络外部性与城市群集聚经济[J]. 产业经济研究, 2019(2):76-87.
|
| [21] |
盛科荣, 李晓瑞, 孙威, 等. 中国城市网络地位对碳排放效率的影响[J]. 地理学报, 2023, 78(11):2864-2882.
|
| [22] |
盛科荣, 王传阳, 张杰, 等. 技术流动视角下中国城市网络权力与知识生产的交互影响[J]. 经济地理, 2023, 43(7):130-138.
|
| [23] |
盛科荣, 王丽萍, 孙威. 网络权力、知识溢出对中国城市绿色经济效率的影响[J]. 资源科学, 2021, 43(8):1509-1521.
|
| [24] |
张明斗, 李学思. 网络节点特征与城市绿色创新效率提升——基于节点枢纽性与节点聚集度视角[J]. 西部论坛, 2022, 32(2):1-15.
|
| [25] |
|
| [26] |
|
| [27] |
|
| [28] |
|
| [29] |
李恒, 殷志高. 金融空间关联网络的平衡发展效应——基于网络节点中心性视角[J]. 财经科学, 2024(1):33-46.
|
| [30] |
邵帅, 张可, 豆建民. 经济集聚的节能减排效应:理论与中国经验[J]. 管理世界, 2019, 35(1):36-60,226.
|
| [31] |
|
| [32] |
程名望, 贾晓佳, 仇焕广. 中国经济增长(1978—2015):灵感还是汗水?[J]. 经济研究, 2019, 54(7):30-46.
|
| [33] |
|
| [34] |
|
| [35] |
|
| [36] |
|
| [37] |
黄群慧, 余泳泽, 张松林. 互联网发展与制造业生产率提升:内在机制与中国经验[J]. 中国工业经济, 2019(8):5-23.
|
| [38] |
王雨, 张京祥. 区域经济一体化的机制与效应——基于制度距离的空间发展解释[J]. 经济地理, 2022, 42(1):28-36.
|
/
| 〈 |
|
〉 |