
Spatiotemporal Characteristics and Driving Factors of the Coupled Coordination Between Digital Intelligence Development and Carbon Productivity in Urban Agglomerations of the Middle Reaches of Yangtze River
Received date: 2024-06-16
Revised date: 2024-09-30
Online published: 2024-11-29
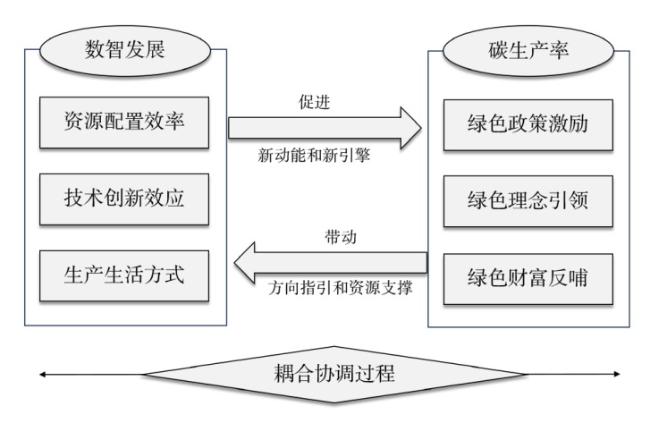
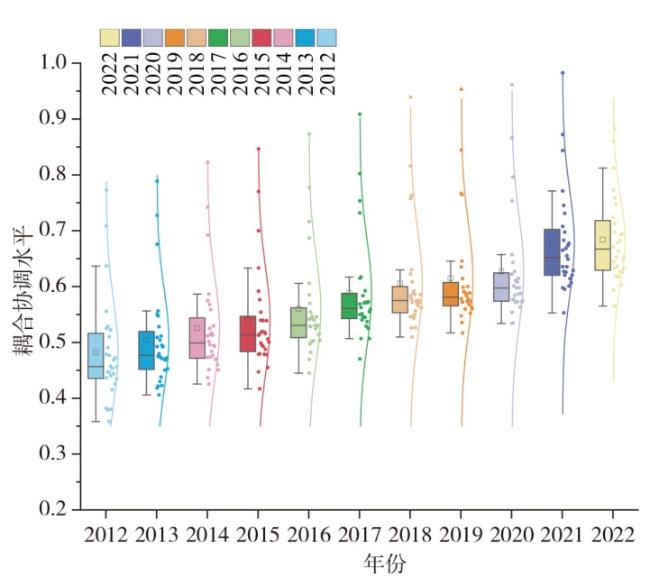
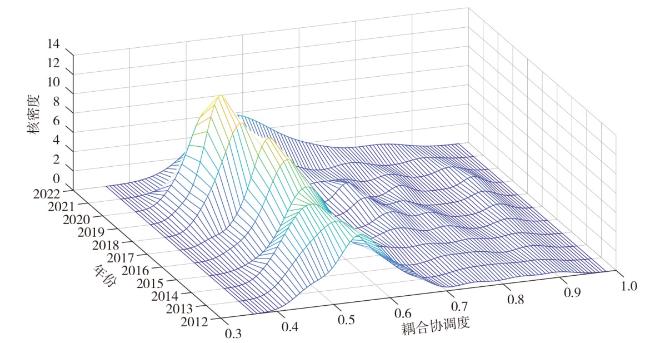
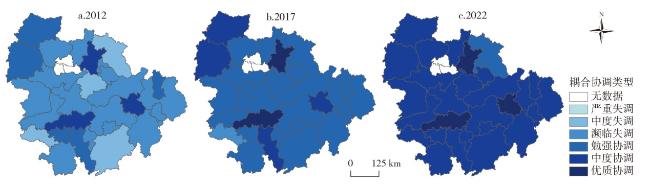
Based on the panel data from 28 cities at prefecture level and above of urban agglomerations in the middle reaches of the Yangtze River from 2012 to 2022,this study employs methods such as the entropy method,coupling coordination degree model, and spatial Durbin model to discuss the spatiotemporal characteristics and driving factors of the coupling coordination between digital intelligence development and carbon productivity. It's found that: 1) From 2012 to 2022, the coupling coordination level between digital intelligence development and carbon productivity exhibited a steady upward trend,with a concentration around the median from 2012 to 2020, and a spread towards both ends from 2021 to 2022,which indicates that the right tailing trend is more obvious than the left tailing trend, and the overall peak shifts towards a higher degree of coordination. 2) A "multi-core" growth pattern has emerged, centered around two high-quality coordinated cities which are Wuhan and Changsha, and "one intermediate coordinated city which is Nanchang,leading to a transition from overall imbalance to a more balanced state with gradually diminishing differences in coordination degrees. 3) There is a significant positive spatial autocorrelation in the coupling coordination between digital intelligence development level and carbon productivity in urban agglomerations of the middle reaches of the Yangtze River. Financial development, technological support, and industrial structure play a positive driving role, human capital has a negative impact.
XIONG Lei , ZHANG Qi , YAN Youliang , JIANG Song , SU Liyun . Spatiotemporal Characteristics and Driving Factors of the Coupled Coordination Between Digital Intelligence Development and Carbon Productivity in Urban Agglomerations of the Middle Reaches of Yangtze River[J]. Economic geography, 2024 , 44(10) : 46 -54 . DOI: 10.15957/j.cnki.jjdl.2024.10.005
表1 数智融合评价指标体系Tab.1 Evaluation index system for digital intelligence integration |
| 目标层 | 系统层 | 准则层 | 指标层(属性) | 权重 |
|---|---|---|---|---|
| 数智 融合 指数 | 数字化 | 数字 基础 设施 | 宽带接入用户数(+) | 0.184 |
| 移动电话用户数(+) | 0.011 | |||
| 邮政业务总量(+) | 0.089 | |||
| 数字 普及 推广 | 数字普惠金融指数(+) | 0.015 | ||
| 国际互联网用户数(+) | 0.025 | |||
| 信息传输、计算机服务和软件业从业人员占比(+) | 0.023 | |||
| 数字 经济 创新 | 软件著作权登记数(+) | 0.018 | ||
| 战略新兴行业从业人员数(+) | 0.134 | |||
| 数据要素利用水平(+) | 0.015 | |||
| 智能化 | 智能化 投入 | 科学研究和技术服务业从业人员数(+) | 0.091 | |
| 普通高等学校数(+) | 0.082 | |||
| 科学技术支出占地方财政支出比重(+) | 0.024 | |||
| 智能化 创新 | 人工智能企业数(+) | 0.157 | ||
| 智能专利申请数(+) | 0.114 | |||
| 机器人安装密度(+) | 0.019 |
表2 2012—2022年长江中游城市群数智发展与碳生产率耦合协调水平的全局莫兰指数Tab.2 Moran's index of the coupling coordination level of digital intelligence development and carbon productivity in urban agglomerations of the middle reaches of the Yangtze River from 2012 to 2022 |
| 年份 | 2012 | 2013 | 2014 | 2015 | 2016 | 2017 | 2018 | 2019 | 2020 | 2021 | 2022 |
|---|---|---|---|---|---|---|---|---|---|---|---|
| Moran's I | 0.387 | 0.390 | 0.395 | 0.395 | 0.412 | 0.386 | 0.385 | 0.396 | 0.403 | 0.392 | 0.404 |
| 标准差 | 0.104 | 0.103 | 0.102 | 0.102 | 0.102 | 0.102 | 0.100 | 0.100 | 0.101 | 0.104 | 0.109 |
| Z值 | 4.076 | 4.148 | 4.227 | 4.219 | 4.405 | 4.156 | 4.210 | 4.320 | 4.368 | 3.274 | 2.865 |
| P值 | 0.000 | 0.000 | 0.000 | 0.000 | 0.000 | 0.000 | 0.000 | 0.000 | 0.000 | 0.000 | 0.000 |
表3 空间杜宾模型检验回归结果Tab.3 Regression results of spatial Durbin model |
| SDM模型检验 | |||
|---|---|---|---|
| 空间固定效应(1) | 时间固定效用(2) | 双固定效应(3) | |
| Finance | 0.0213***(3.12) | 0.0307***(3.89) | 0.0236***(2.77) |
| Lobor | -0.1372**(-2.03) | -0.1401***(-2.74) | -0.1283**(-1.98) |
| TEC | 0.0710**(2.36) | 0.0802***(3.35) | 0.0673**(2.01) |
| IS | 0.0045*(1.87) | 0.0039**(1.98) | 0.0043*(1.66) |
| W·Finance | 0.0100***(3.44) | 0.0076***(3.17) | 0.0087***(3.26) |
| W·Lobor | -0.0153*(-1.71) | -0.0201*(-1.94) | -0.0147*(-1.83) |
| W·TEC | 0.0108**(2.09) | 0.0140**(2.36) | 0.0122**(2.14) |
| W·IS | 0.0008*(1.73) | 0.0015*(1.92) | 0.0012*(1.81) |
| Year | NO | YES | YES |
| Region | YES | NO | YES |
| N | 308 | 308 | 308 |
| R2 | 0.129 | 0.106 | 0.158 |
注:*、**、***分别表示10%、5%、1%显著性水平,括号内为t值。表4同。 |
表4 效应分解结果Tab.4 Results of effect decomposition |
| SDM模型 | |||
|---|---|---|---|
| 直接效应 | 间接效应 | 总效应 | |
| Finance | 0.0218***(3.47) | 0.0165*(1.88) | 0.0383***(3.07) |
| Lobor | -0.1163***(3.12) | 0.0321*(1.74) | -0.0842**(2.11) |
| TEC | 0.0496**(2.04) | 0.0122*(0.19) | 0.0618**(2.34) |
| IS | 0.0035**(1.99) | 0.0012(1.58) | 0.0047*(1.73) |
| Year | YES | YES | YES |
| Region | YES | YES | YES |
| [1] |
杨刚强, 王海森, 范恒山, 等. 数字经济的碳减排效应:理论分析与经验证据[J]. 中国工业经济, 2023(5):80-98.
|
| [2] |
赵涛, 张智, 梁上坤. 数字经济、创业活跃度与高质量发展——来自中国城市的经验证据[J]. 管理世界, 2020, 36(10):65-76.
|
| [3] |
王淑英, 卫朝蓉, 寇晶晶. 产业结构调整与碳生产率的空间溢出效应——基于金融发展的调节作用研究[J]. 工业技术经济, 2021, 40(2):138-145.
|
| [4] |
韩璐, 陈松, 梁玲玲. 数字经济、创新环境与城市创新能力[J]. 科研管理, 2021, 42(4):35-45.
|
| [5] |
熊磊, 石恒贵, 文泽宙. 数字技术驱动下普惠金融的减贫效果评价及其创新发展[J]. 科技管理研究, 2023, 43(12):68-76.
|
| [6] |
周青, 王燕灵, 杨伟. 数字化水平对创新绩效影响的实证研究:基于浙江省73个县(区、市)的面板数据[J]. 科研管理, 2020, 41(7):120-129.
|
| [7] |
周文辉, 王鹏程, 杨苗. 数字化赋能促进大规模定制技术创新[J]. 科学学研究, 2018, 36(8):1516-1523.
|
| [8] |
杨德明, 刘泳文. “互联网+”为什么加出了业绩[J]. 中国工业经济, 2018(5):80-98.
|
| [9] |
张争妍, 李豫新. 数字经济对我国碳排放的影响研究[J]. 财经理论与实践, 2022, 43(5):146-154.
|
| [10] |
孟凡生, 赵艳. 工业智能化、产业集聚与碳生产率[J]. 科学学研究, 2023, 41(10):1789-1799.
|
| [11] |
唐志鹏, 刘卫东, 宋涛. 基于混合地理加权回归的中国省域碳生产率影响因素分析[J]. 资源科学, 2017, 39(12):2223-2232.
|
| [12] |
|
| [13] |
裴海峰, 陈镜如. 基于省级面板数据的技术创新与碳生产率的关系研究[J]. 经济与管理评论, 2023, 39(4):109-119.
|
| [14] |
宋成镇, 刘庆芳, 马伟, 等. 技术创新对黄河流域地区和长江经济带碳生产率影响路径比较——基于数字金融的中介效应[J]. 资源科学, 2024, 46(3):450-461.
|
| [15] |
张文彬, 李国平. 中国区域经济增长及可持续性研究——基于脱钩指数分析[J]. 经济地理, 2015, 35(11):8-14.
|
| [16] |
周磊, 龚志民. 数字经济水平对城市绿色高质量发展的提升效应[J]. 经济地理, 2022, 42(11):133-141.
|
| [17] |
刘文俊, 彭慧. 区域制造企业数字化转型影响绿色全要素生产率的空间效应[J]. 经济地理, 2023, 43(6):33-44.
|
| [18] |
马中东, 周桐桐, 高建刚. 数字经济对黄河流域制造业绿色全要素生产率的影响研究[J]. 人民黄河, 2023, 45(4):6-12,34.
|
| [19] |
|
| [20] |
徐维祥, 周建平, 刘程军. 数字经济发展对城市碳排放影响的空间效应[J]. 地理研究, 2022, 41(1):111-129.
|
| [21] |
荆文君, 孙宝文. 数字经济促进经济高质量发展:一个理论分析框架[J]. 经济学家, 2019(2):66-73.
|
| [22] |
葛立宇, 莫龙炯, 黄念兵. 数字经济发展、产业结构升级与城市碳排放[J]. 现代财经(天津财经大学学报), 2022, 42(10):20-37.
|
| [23] |
马海良, 张格琳. 偏向性技术进步对碳排放效率的影响研究——以长江经济带为例[J]. 软科学, 2021, 35(10):100-106.
|
| [24] |
|
| [25] |
宋洋. 数字经济、技术创新与经济高质量发展:基于省级面板数据[J]. 贵州社会科学, 2020(12):105-112.
|
| [26] |
谢云飞. 数字经济对区域碳排放强度的影响效应及作用机制[J]. 当代经济管理, 2022, 44(2):68-78.
|
| [27] |
郭俊杰, 方颖, 郭晔. 环境规制、短期失败容忍与企业绿色创新——来自绿色信贷政策实践的证据[J]. 经济研究, 2024, 59(3):112-129.
|
| [28] |
朱建华, 王虹吉, 郑鹏. 贵州省循环经济与绿色金融耦合协调发展研究[J]. 经济地理, 2019, 39(12):119-128.
|
| [29] |
潘为华, 贺正楚, 潘红玉. 中国数字经济发展的时空演化和分布动态[J]. 中国软科学, 2021(10):137-147.
|
| [30] |
张云, 柏培文. 数智化如何影响双循环参与度与收入差距——基于省级—行业层面数据[J]. 管理世界, 2023, 39(10):58-83.
|
| [31] |
孙小强, 高秀云, 王玉梅. 制造业数智化融合转型发展的关键要素、机理分析及评价指标研究[J]. 中国科学院院刊, 2024, 39(2):323-332.
|
| [32] |
|
| [33] |
陈佳琦, 姜海宁, 金星星. 长三角地区科技创新与绿色发展耦合协调格局及驱动机制[J]. 长江流域资源与环境, 2024, 33(5):924-936.
|
| [34] |
邓宗兵, 肖沁霖, 王炬, 等. 中国数字经济与绿色发展耦合协调的时空特征及驱动机制[J]. 地理学报, 2024, 79(4):971-990.
|
| [35] |
李俊明, 魏雯琪, 张鹏, 等. 中国市域数字经济发展对减污降碳协同的促进效应及其空间分异[J]. 经济地理, 2023, 43(12):169-180
|
| [36] |
熊磊, 胡石其. 长江经济带生态环境保护中政府与企业的演化博弈分析[J]. 科技管理研究, 2018, 38(17):252-257.
|
/
| 〈 |
|
〉 |