
Inter Provincial Differences in the Proportion of Labor Income in China
Received date: 2024-01-13
Revised date: 2024-08-15
Online published: 2024-11-29
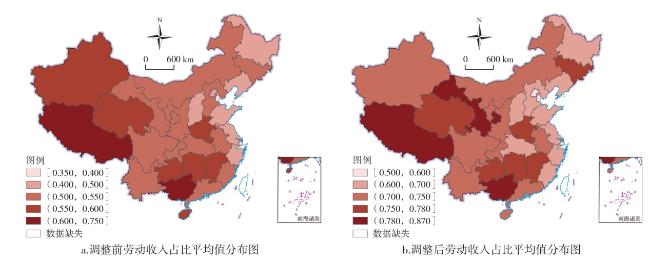
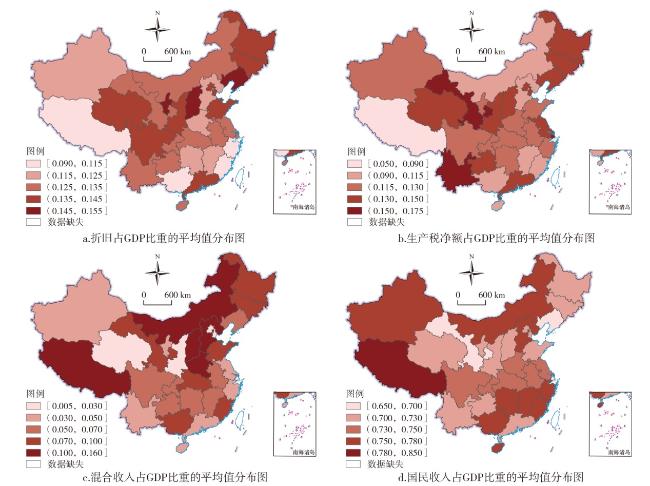
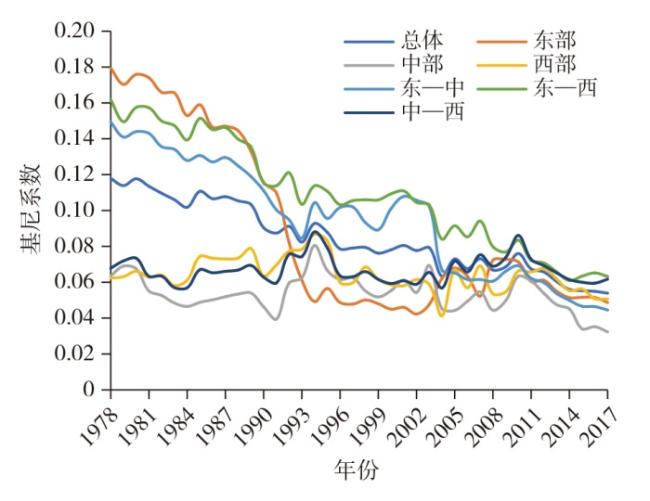
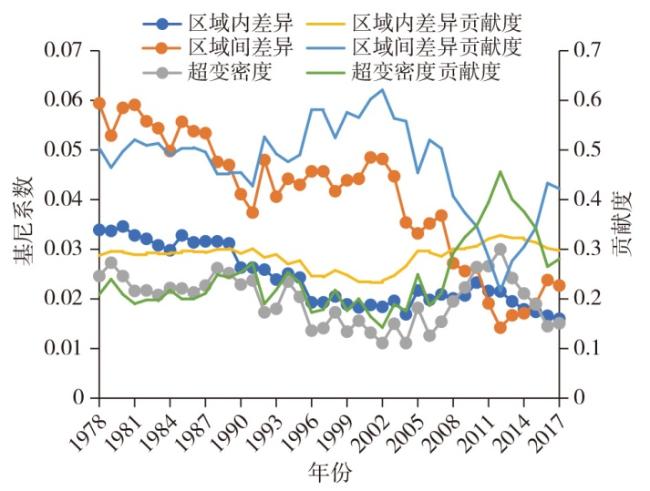
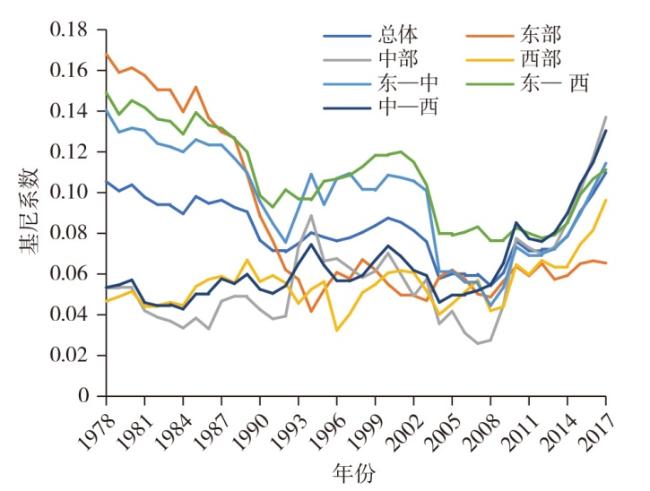
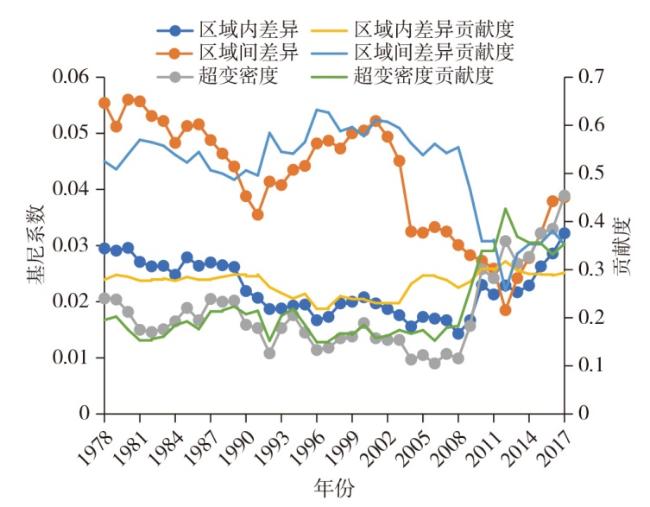
This article re-adjusts the calculation formula for the labor income share, estimates the labor income share of China's provincial-level regions from 1978 to 2017, calculates the bias parameters of technological progress in each provincial-level regions using a standardized supply-side system approach,and conducts a trend analysis of the labor income share across provincial-level regions. It uses the Dagum Gini coefficient to depict the evolution pattern of inter-provincial differences in China's labor income share,and analyzes its sources. Based on the spatial econometric method,it explores the reasons behind the formation of the spatial distribution pattern of factor income. It's found that: 1) The overall spatial distribution pattern of labor income share exhibits a trend,which is the highest in the west of China,followed by central China and the east of China, the more developed region is, the lower the labor income share is. The spatial distribution patterns of depreciation and net production taxes in GDP are opposite to this trend,while the spatial distribution pattern of mixed income in GDP aligns with it. 2) The overall average trend of labor income share of all provincial-level regions showed an inverted U-shape,with the most obvious upward trend in Beijing and Shanghai and the most obvious downward trend in Xizang. Technological progress is biased toward capital in most provincial-level regions,which is a crucial factor contributing to the notable decline in the labor income share. 3) The Gini coefficient reflecting inter-provincial differences in labor income share remains relatively large. From the perspective of intra-regional disparities, the eastern region exhibits the largest internal gap, which is also showing a significant downward trend. In terms of inter-regional Gini coefficients,the disparities between the eastern and central regions, as well as between the eastern and western regions, are more pronounced,while the disparity between the central and western regions is relatively smaller. 4) Spatial econometric analysis reveals that industrial structure exerts a negative spatial spillover effect on labor income share.
LIU Changgeng , LIU Linzhi . Inter Provincial Differences in the Proportion of Labor Income in China[J]. Economic geography, 2024 , 44(10) : 12 -23 . DOI: 10.15957/j.cnki.jjdl.2024.10.002
表1 中国各省份个体户业主混合收入计算方法及分布Tab.1 Calculation method and distribution of mixed income of individual business owners in various provincial-level regions of China |
| 混合收入计算方法 | 1993—2003年 | 2009—2017年 |
|---|---|---|
| 计入营业盈余的省份 | 北京、天津、山西、内蒙古、江苏、浙江、安徽、河南、广东、广西、海南、重庆、陕西、甘肃、青海、宁夏 | 吉林、黑龙江、浙江、江西、重庆、四川、陕西、甘肃 |
| 计入劳动者报酬的省份 | 河北、辽宁、吉林、黑龙江、上海、福建、江西、山东、湖北、湖南、四川、贵州、云南、西藏、新疆 | 北京、天津、山西、内蒙古、江苏、安徽、河南、广东、广西、海南、青海、宁夏、河北、辽宁、上海、福建、山东、湖北、湖南、贵州、云南、西藏、新疆 |
表2 1978—2017年中国各省份劳动收入占比的阶段性特征(调整后)(单位:%)Tab.2 Labor income share in various provincial-level regions of China from 1978 to 2017 after adjustment (unit:%) |
| 省份 | 1978年 | 1978—1992年均值 | 1992年 | 1992—2002年均值 | 2002年 | 2002—2012年均值 | 2012年 | 2012—2017年均值 | 2017年 |
|---|---|---|---|---|---|---|---|---|---|
| 北京 | 35.19 | 41.96 | 52.23 | 69.71 | 65.59 | 66.75 | 70.96 | 71.44 | 71.13 |
| 天津 | 43.19 | 44.70 | 55.32 | 70.96 | 71.30 | 54.76 | 52.64 | 54.02 | 58.57 |
| 河北 | 64.94 | 63.77 | 57.13 | 62.32 | 61.82 | 63.26 | 63.95 | 62.36 | 59.47 |
| 山西 | 67.85 | 66.67 | 64.53 | 83.07 | 83.73 | 61.95 | 52.57 | 54.58 | 51.80 |
| 内蒙古 | 69.57 | 67.86 | 71.16 | 91.57 | 101.91 | 64.66 | 47.30 | 49.37 | 52.30 |
| 辽宁 | 47.80 | 52.13 | 58.88 | 62.80 | 59.27 | 67.30 | 67.48 | 62.19 | 55.30 |
| 吉林 | 75.62 | 74.48 | 66.47 | 78.27 | 82.18 | 72.89 | 74.65 | 85.65 | 97.25 |
| 黑龙江 | 57.67 | 67.25 | 61.23 | 61.15 | 61.95 | 61.31 | 69.01 | 76.06 | 81.76 |
| 上海 | 28.61 | 38.32 | 53.12 | 54.21 | 58.18 | 56.50 | 61.10 | 62.47 | 62.08 |
| 江苏 | 59.13 | 62.36 | 63.01 | 72.06 | 74.59 | 61.55 | 54.57 | 54.21 | 52.52 |
| 浙江 | 69.23 | 66.90 | 62.71 | 65.52 | 68.75 | 63.33 | 67.34 | 73.32 | 76.50 |
| 安徽 | 78.82 | 79.25 | 73.48 | 81.42 | 84.64 | 69.51 | 63.38 | 62.01 | 59.36 |
| 福建 | 78.83 | 77.05 | 74.21 | 64.26 | 61.50 | 63.18 | 61.30 | 61.47 | 57.06 |
| 江西 | 80.55 | 76.62 | 75.39 | 79.53 | 83.54 | 73.15 | 75.98 | 75.57 | 76.63 |
| 山东 | 59.75 | 66.21 | 59.64 | 63.57 | 72.70 | 58.69 | 50.40 | 51.59 | 52.48 |
| 河南 | 74.46 | 75.52 | 74.57 | 96.56 | 95.01 | 70.21 | 56.51 | 52.47 | 45.71 |
| 湖北 | 68.94 | 69.84 | 67.13 | 75.82 | 81.17 | 67.12 | 58.94 | 55.70 | 54.90 |
| 湖南 | 79.26 | 78.98 | 70.20 | 81.40 | 85.43 | 69.65 | 64.56 | 64.31 | 63.06 |
| 广东 | 80.05 | 77.40 | 73.01 | 75.97 | 74.37 | 63.18 | 64.08 | 62.36 | 60.18 |
| 广西 | 77.66 | 78.81 | 75.70 | 89.26 | 95.74 | 75.71 | 67.91 | 67.32 | 64.11 |
| 海南 | 81.40 | 78.10 | 63.42 | 77.31 | 80.89 | 74.86 | 76.01 | 71.42 | 68.60 |
| 重庆 | 76.87 | 72.16 | 61.50 | 76.03 | 73.48 | 71.71 | 73.67 | 79.62 | 84.46 |
| 四川 | 76.80 | 73.51 | 75.18 | 75.50 | 78.02 | 73.92 | 71.91 | 77.16 | 82.80 |
| 贵州 | 69.18 | 75.82 | 69.65 | 89.75 | 85.11 | 73.82 | 73.79 | 72.62 | 69.15 |
| 云南 | 73.96 | 71.64 | 69.14 | 71.32 | 73.27 | 71.72 | 72.28 | 70.13 | 70.63 |
| 西藏 | 98.32 | 100.03 | 95.50 | 95.33 | 84.72 | 80.71 | 68.15 | 66.98 | 62.42 |
| 陕西 | 73.47 | 75.40 | 78.28 | 88.57 | 88.95 | 65.78 | 59.55 | 67.78 | 69.88 |
| 甘肃 | 77.74 | 73.57 | 68.91 | 84.81 | 95.01 | 79.51 | 84.19 | 93.91 | 107.87 |
| 青海 | 77.72 | 77.58 | 79.32 | 92.46 | 93.33 | 75.07 | 64.52 | 73.70 | 77.73 |
| 宁夏 | 68.47 | 70.47 | 69.68 | 85.37 | 93.45 | 74.73 | 66.09 | 68.15 | 65.85 |
| 新疆 | 70.76 | 72.27 | 69.26 | 75.82 | 78.49 | 71.80 | 72.85 | 75.95 | 74.55 |
| 均值 | 69.09 | 69.89 | 68.03 | 77.15 | 78.97 | 68.33 | 65.41 | 66.96 | 67.29 |
表3 1978—2017年中国各省份技术进步偏向各参数估计Tab.3 Estimation of technological progress bias parameters in various provincial-level regions of China from 1978 to 2017 |
| 省份 | 联合似然值 | |||||||
|---|---|---|---|---|---|---|---|---|
| 北京 | 0.421***(0.010) | 0.928***(0.014) | 0.430***(0.011) | -0.114**(0.049) | 0.543**(0.234) | 0.361***(0.063) | 1.652***(0.128) | 137.032 |
| 天津 | 0.481***(0.012) | 0.934***(0.015) | 0.477***(0.015) | -0.001(0.002) | 9.343**(4.047) | 0.190***(0.012) | 1.485***(0.113) | 93.074 |
| 河北 | 0.590***(0.012) | 0.996***(0.004) | 0.358***(0.004) | 0.520(0.430) | 1.533***(0.112) | -0.647(0.765) | 1.918***(0.475) | 258.714 |
| 山西 | 0.489***(0.016) | 0.953***(0.043) | 0.316***(0.020) | 0.299*(0.178) | 1.647***(0.113) | -0.271(0.359) | 2.111*(1.152) | 87.960 |
| 内蒙古 | 0.486***(0.024) | 0.935***(0.046) | 0.318***(0.028) | 0.295**(0.117) | 1.568***(0.110) | -0.231(0.214) | 2.112**(0.849) | 82.212 |
| 辽宁 | 0.666***(0.014) | 0.985***(0.004) | 0.399***(0.007) | -0.396***(0.095) | 0.574***(0.152) | 0.799***(0.139) | 0.880***(0.131) | 174.527 |
| 吉林 | 0.495***(0.009) | 1.429***(0.035) | 0.297***(0.008) | 0.140***(0.002) | 1.076***(0.038) | -0.334***(0.004) | 1.088**(0.458) | 165.650 |
| 黑龙江 | 0.567***(0.018) | 0.989***(0.005) | 0.328***(0.010) | -0.363***(0.139) | 0.779***(0.275) | 1.010***(0.281) | 1.064***(0.224) | 132.637 |
| 上海 | 0.595***(0.014) | 0.946***(0.009) | 0.492***(0.005) | -0.175***(0.055) | 0.147(0.106) | 0.313***(0.056) | 1.087***(0.074) | 198.654 |
| 江苏 | 0.412***(0.010) | 0.819***(0.010) | 0.310***(0.007) | 0.165***(0.004) | 1.336***(0.057) | -0.018**(0.009) | 3.654***(1.143) | 173.934 |
| 浙江 | 0.571***(0.015) | 1.006***(0.002) | 0.330***(0.006) | 0.788***(0.168) | 1.481***(0.120) | -1.368***(0.352) | 2.002***(0.124) | 210.745 |
| 安徽 | 0.462***(0.013) | 0.841***(0.015) | 0.216***(0.008) | 0.165***(0.006) | 1.189***(0.059) | -0.093***(0.021) | 1.973***(0.456) | 154.508 |
| 福建 | 0.512***(0.015) | 0.984***(0.003) | 0.306***(0.005) | 0.607***(0.084) | 0.947***(0.072) | -1.009***(0.179) | 0.651***(0.094) | 212.747 |
| 江西 | 0.471***(0.013) | 1.001***(0.001) | 0.223***(0.006) | -1.014(0.620) | 2.404***(0.201) | 3.999*(2.148) | 2.070***(0.191) | 175.908 |
| 山东 | 0.529***(0.011) | 0.881***(0.012) | 0.354***(0.008) | 0.189***(0.008) | 1.030***(0.043) | -0.066***(0.014) | 2.092***(0.330) | 201.892 |
| 河南 | 0.414***(0.022) | 0.807***(0.088) | 0.199***(0.034) | 0.181***(0.030) | 1.397***(0.159) | -0.084(0.087) | 2.801*(1.448) | 40.165 |
| 湖北 | 0.469***(0.014) | 1.554***(0.056) | 0.371***(0.013) | 0.100***(0.003) | 0.753***(0.062) | 0.044***(0.009) | 2.394***(0.630) | 129.590 |
| 湖南 | 0.417***(0.012) | 0.926***(0.017) | 0.239***(0.008) | 0.221***(0.024) | 1.289***(0.086) | -0.213***(0.069) | 1.431***(0.370) | 157.307 |
| 广东 | 0.465***(0.011) | 1.018***(0.003) | 0.274***(0.006) | -0.281***(0.067) | 2.738***(0.124) | 1.154***(0.194) | 1.319***(0.129) | 166.183 |
| 广西 | 0.543***(0.022) | 1.008***(0.003) | 0.222***(0.011) | -0.436***(0.126) | 2.861***(0.207) | 2.048***(0.414) | 1.721***(0.178) | 79.730 |
| 海南 | 0.495***(0.013) | 1.004***(0.002) | 0.216***(0.006) | -0.481***(0.176) | 2.580***(0.176) | 2.237***(0.659) | 1.854***(0.184) | 160.313 |
| 重庆 | 0.429***(0.014) | 1.009***(0.006) | 0.262***(0.007) | 0.496***(0.180) | 1.690***(0.221) | -0.919*(0.513) | 2.594***(0.191) | 159.516 |
| 四川 | 0.514***(0.015) | 0.913***(0.004) | 0.246***(0.004) | 0.096***(0.005) | 0.611***(0.071) | 0.0213(0.015) | 5.580***(1.384) | 214.608 |
| 贵州 | 0.356***(0.015) | 1.003***(0.004) | 0.232***(0.012) | -0.525(0.485) | 1.586***(0.539) | 2.147(1.575) | 1.350***(0.415) | 41.661 |
| 云南 | 0.515***(0.012) | 1.000***(0.000) | 0.281***(0.004) | 2.181(1.729) | 0.456(0.306) | -5.254(4.450) | 0.408(0.322) | 231.369 |
| 西藏 | 0.389***(0.007) | 0.701***(0.039) | 0.042***(0.007) | 0.141***(0.005) | 1.272***(0.040) | -0.237***(0.037) | 0.960***(0.118) | 88.964 |
| 陕西 | 0.393***(0.021) | 1.944***(0.435) | 0.347***(0.041) | 0.122***(0.004) | 1.026***(0.091) | 0.053***(0.012) | 1.343*(0.810) | 18.594 |
| 甘肃 | 0.435***(0.011) | 0.782***(0.036) | 0.157***(0.016) | 0.093***(0.007) | 1.179***(0.148) | 0.159***(0.032) | 1.739***(0.468) | 73.058 |
| 青海 | 0.476***(0.018) | 1.013***(0.012) | 0.230***(0.015) | -0.007(0.035) | -0.470(1.554) | 0.439***(0.128) | 0.668*(0.381) | 33.077 |
| 宁夏 | 0.419***(0.015) | 1.004***(0.011) | 0.283***(0.011) | -0.174(0.718) | 2.254**(1.143) | 0.825(1.830) | 1.492*(0.848) | 78.993 |
| 新疆 | 0.542***(0.012) | 0.999***(0.013) | 0.274***(0.007) | -0.323(6.150) | 1.771(5.132) | 1.224(16.26) | 1.386(1.994) | 186.491 |
注:括号内数值为标准误;***p<0.01,**p<0.05,*p<0.10。表6同。 |
表4 中国各省份技术进步方向和要素替代弹性类型Tab.4 Direction of technological progress and type of factor substitution elasticity in various provincial-level regions of China |
| 劳动增进型技术进步 | 资本增进型技术进步 | |
|---|---|---|
| 要素替代弹性大于1 | 浙江、吉林(劳动偏向) | 广东、海南、湖北、广西、贵州、陕西、宁夏、青海(资本偏向) |
| 要素替代弹性小于1 | 山东、江苏、河北、福建、山西、内蒙古、安徽、江西、河南、湖南、西藏(资本偏向) | 上海、北京、天津、辽宁、黑龙江、重庆、四川、甘肃、新疆 (劳动偏向) |
表5 1978—1997年劳动收入占比的莫兰指数双边检验结果Tab.5 Bilateral test of Moran's I for the proportion of labor income in 1978-1997 |
| 年份 | Moran's I | Z | 年份 | Moran's I | Z |
|---|---|---|---|---|---|
| 1978 | 0.315 | 3.139 | 1998 | 0.116 | 1.293 |
| 1979 | 0.311 | 3.116 | 1999 | 0.123 | 1.356 |
| 1980 | 0.359 | 3.537 | 2000 | 0.102 | 1.174 |
| 1981 | 0.354 | 3.518 | 2001 | 0.136 | 1.458 |
| 1982 | 0.340 | 3.398 | 2002 | 0.170 | 1.760 |
| 1983 | 0.347 | 3.471 | 2003 | 0.161 | 1.679 |
| 1984 | 0.347 | 3.462 | 2004 | 0.334 | 3.236 |
| 1985 | 0.347 | 3.473 | 2005 | 0.238 | 2.472 |
| 1986 | 0.345 | 3.430 | 2006 | 0.190 | 2.050 |
| 1987 | 0.365 | 3.584 | 2007 | 0.236 | 2.481 |
| 1988 | 0.389 | 3.822 | 2008 | 0.337 | 3.224 |
| 1989 | 0.335 | 3.311 | 2009 | 0.306 | 2.934 |
| 1990 | 0.258 | 2.603 | 2010 | 0.155 | 1.650 |
| 1991 | 0.217 | 2.251 | 2011 | 0.246 | 2.418 |
| 1992 | 0.379 | 3.700 | 2012 | 0.143 | 1.533 |
| 1993 | 0.133 | 1.446 | 2013 | 0.209 | 2.112 |
| 1994 | 0.034 | 0.588 | 2014 | 0.151 | 1.615 |
| 1995 | 0.125 | 1.384 | 2015 | 0.158 | 1.662 |
| 1996 | 0.220 | 2.218 | 2016 | 0.223 | 2.242 |
| 1997 | 0.149 | 1.594 | 2017 | 0.176 | 1.871 |
表6 面板回归和空间杜宾模型回归结果Tab.6 Results of panel regression and spatial Durbin model regression |
| 变量 | 面板回归 | x | Wx |
|---|---|---|---|
| is | -0.720***(0.044) | -0.617***(0.045) | -0.193**(0.086) |
| pgdp | -0.006***(0.002) | -0.017***(0.027) | 0.014***(0.004) |
| edu | 0.010**(0.004) | 0.014**(0.004) | 0.013(0.009) |
| ur | -0.188(0.046) | 0.015(0.047) | 0.037(0.094) |
| fd | 0.033***(0.009) | 0.052***(0.009) | 0.105***(0.019) |
| soc | -0.028(0.043) | -0.092**(0.046) | 0.532***(0.089) |
| gr | -0.206***(0.054) | -0.185***(0.056) | -0.300**(0.118) |
| gi | -0.000(0.000) | -0.000(0.000) | 0.000(0.000) |
| [1] |
张璟龙, 刘李红. 共同富裕视阈下协调配套的分配制度体系——思想渊源、演进历程与实践进路[J]. 经济学家, 2023(2):5-14.
|
| [2] |
刘长庚, 柏园杰. 中国劳动收入居于主体地位吗——劳动收入份额再测算与国际比较[J]. 经济学动态, 2022(7):31-50.
|
| [3] |
|
| [4] |
|
| [5] |
徐雷, 杨家辉, 郑理. 中国劳动收入份额的时空分异特征及动态演变研究[J]. 北京工商大学学报:社会科学版, 2021, 36(1):92-104.
|
| [6] |
李稻葵, 刘霖林, 王红领. GDP中劳动份额演变的U型规律[J]. 经济研究, 2009, 44(1):70-82.
|
| [7] |
李琦. 中国劳动份额再估计[J]. 统计研究, 2012, 29(10):23-29.
|
| [8] |
刘亚琳, 茅锐, 姚洋. 结构转型、金融危机与中国劳动收入份额的变化[J]. 经济学(季刊), 2018, 17(2):609-632.
|
| [9] |
吕光明. 中国劳动收入份额的测算研究:1993—2008[J]. 统计研究, 2011, 28(12):22-28.
|
| [10] |
张车伟. 中国劳动报酬份额变动与总体工资水平估算及分析[J]. 经济学动态, 2012(9):10-19.
|
| [11] |
张晓婧, 丁一兵. 中国行业层面劳动收入份额变动的测算及结构分解[J]. 劳动经济研究, 2022, 10(2):45-72.
|
| [12] |
罗长远, 张军. 经济发展中的劳动收入占比:基于中国产业数据的实证研究[J]. 中国社会科学, 2009(4):65-79,206.
|
| [13] |
白重恩, 钱震杰. 劳动收入份额决定因素:来自中国省际面板数据的证据[J]. 世界经济, 2010, 33(12):3-27.
|
| [14] |
刘亚琳, 申广军, 姚洋. 我国劳动收入份额:新变化与再考察[J]. 经济学(季刊), 2022, 22(5):1467-1488.
|
| [15] |
蒋娇燕, 郭继强. 中国技术进步方向:兼顾人力资本变动的测算[J]. 中国科技论坛, 2022(1):55-63,72.
|
| [16] |
张军, 张席斌, 张丽娜. 中国劳动报酬份额变化的动态一般均衡分析[J]. 经济研究, 2022, 57(7):26-44.
|
| [17] |
吴振华. 中国劳动收入份额变动的区域异质性及其影响因素分析[J]. 人口与发展, 2020, 26(3):2-15.
|
| [18] |
谭晓鹏, 钞小静. 中国要素收入分配再测算[J]. 当代经济科学, 2016, 38(6):7-16,122.
|
| [19] |
张亚斌, 吴江, 冯迪. 劳动收入份额的地区差异实证研究——来自中国省级面板数据的证据[J]. 经济地理, 2011, 31(9):1499-1503.
|
| [20] |
白重恩, 钱震杰. 国民收入的要素分配:统计数据背后的故事[J]. 经济研究, 2009, 44(3):27-41.
|
| [21] |
|
| [22] |
|
| [23] |
|
| [24] |
|
| [25] |
张军, 吴桂英, 张吉鹏. 中国省际物质资本存量估算:1952—2000[J]. 经济研究, 2004(10):35-44.
|
| [26] |
单豪杰. 中国资本存量K的再估算:1952—2006年[J]. 数量经济技术经济研究, 2008, 25(10):17-31.
|
| [27] |
|
| [28] |
|
| [29] |
王林辉, 袁礼. 有偏型技术进步、产业结构变迁和中国要素收入分配格局[J]. 经济研究, 2018, 53(11):115-131.
|
| [30] |
孙豪, 曹肖烨, 张俊英, 等. 浙江县域共同富裕的测度、评价及区域分异[J]. 经济地理, 2024, 44(8):97-105.
|
/
| 〈 |
|
〉 |