
Spatial Effect of Public Service Product Supply on the Level of Urban Innovation
Received date: 2024-03-26
Revised date: 2024-06-24
Online published: 2024-09-23
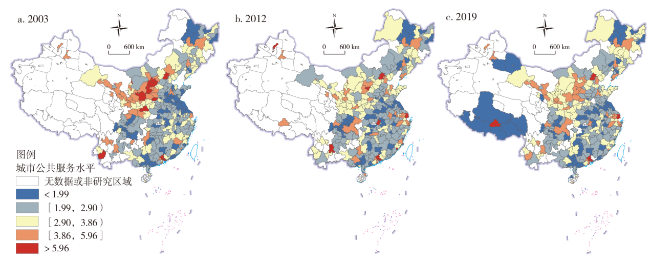
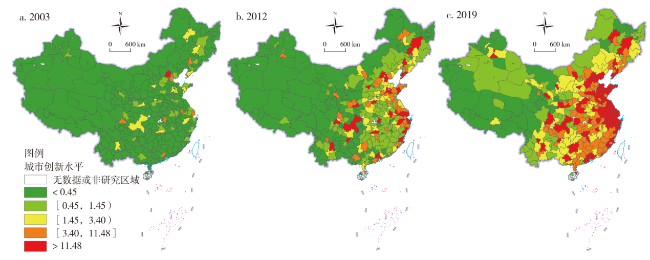
Using the panel data of 276 prefecture-level cities in China from 2003 to 2019, this study empirically analyzes the spatial effect of public service product supply on urban innovation by the means of the spatial Durbin model. The findings are as follows: 1) Public service product supply level and urban innovation level exhibit significant spatial disparities and spatial agglomeration characteristics at the prefecture level. 2) Both public service product supply and urban innovation show spatial autocorrelation in prefecture-level cities of China. The spatial positive correlation of public service product supply initially decreases and then increases,while the spatial positive correlation of urban innovation continues to rise. 3) The public service product supply has a clear positive spatial spillover effect on urban innovation,meaning that public services significantly promote urban innovation both within the region and in neighboring regions. 4) Inter-regional heterogeneity analysis indicates that public service product supply significantly fosters urban innovation in eastern region,whereas the impact is less evident in central and western regions. Additionally, the public service product supply significantly promotes urban innovation in large cities, but this effect is not significant in small and medium-sized cities. Based on the above,it is necessary to redefine governmental roles,enhance regional synergistic governance within urban agglomerations,implement regionally differentiated public service product supply policies,explore regional synergistic development, and thereby promote the advancement of urban innovation in China.
OU Dingyu , HOU Siyao . Spatial Effect of Public Service Product Supply on the Level of Urban Innovation[J]. Economic geography, 2024 , 44(8) : 106 -115 . DOI: 10.15957/j.cnki.jjdl.2024.08.013
表1 公共服务产品供给水平测度指标体系Tab.1 Indicator system for the public service product supply |
| 公共服务种类 | 具体指标 | 单位 | 权重 |
|---|---|---|---|
| 基本生活 | 人均生活用水量 | t/人 | 0.072 |
| 人均生活用电量 | kW·h/人 | 0.069 | |
| 人均生活煤气用量 | m2/人 | 0.086 | |
| 公共教育 | 每万人普通小学和中学数 | 所/万人 | 0.060 |
| 普通小学师生比 | 人/人 | 0.058 | |
| 普通中学师生比 | 人/人 | 0.058 | |
| 卫生医疗 | 每万人医院卫生院数 | 所/万人 | 0.063 |
| 每万人医院卫生院床位数 | 张/万人 | 0.058 | |
| 每万人医院执业医生数 | 人/万人 | 0.058 | |
| 交通通信 | 人均移动电话数 | 部/万人 | 0.082 |
| 人均互联网宽带数 | 户/万人 | 0.060 | |
| 每万人公共汽车数 | 辆/万人 | 0.061 | |
| 人均铺装道路面积 | m2/人 | 0.060 | |
| 人文娱乐 | 每百人图书馆藏书 | 部/百人 | 0.069 |
| 人均绿地面积 | m2/人 | 0.086 |
表2 2019年市域公共服务产品供给指数Tab.2 Public service product supply index at the prefecture level in 2019 |
| 市域 | 指数 | 市域 | 指数 | 市域 | 指数 | 市域 | 指数 | 市域 | 指数 | 市域 | 指数 |
|---|---|---|---|---|---|---|---|---|---|---|---|
| 七台河市 | 2.79 | 双鸭山市 | 3.37 | 常州市 | 3.36 | 榆林市 | 3.12 | 白山市 | 3.81 | 通辽市 | 2.23 |
| 三亚市 | 3.39 | 台州市 | 2.79 | 平凉市 | 3.88 | 武威市 | 3.89 | 白银市 | 3.67 | 遂宁市 | 1.63 |
| 三明市 | 3.09 | 合肥市 | 3.38 | 平顶山市 | 2.72 | 武汉市 | 5.28 | 百色市 | 2.58 | 遵义市 | 2.21 |
| 三门峡市 | 3.35 | 吉安市 | 2.42 | 广元市 | 2.45 | 永州市 | 1.90 | 益阳市 | 1.99 | 邢台市 | 2.38 |
| 上海市 | 10.44 | 吉林市 | 3.51 | 广安市 | 1.71 | 汉中市 | 3.15 | 盐城市 | 1.90 | 邯郸市 | 2.35 |
| 上饶市 | 2.56 | 吕梁市 | 4.44 | 广州市 | 10.25 | 汕头市 | 2.41 | 盘锦市 | 3.48 | 邵阳市 | 1.84 |
| 东莞市 | 8.75 | 吴忠市 | 3.73 | 庆阳市 | 3.66 | 汕尾市 | 1.92 | 眉山市 | 2.21 | 郑州市 | 3.45 |
| 东营市 | 3.56 | 周口市 | 2.37 | 廊坊市 | 2.75 | 江门市 | 2.95 | 石嘴山市 | 3.07 | 郴州市 | 2.18 |
| 中山市 | 4.51 | 龙岩市 | 0.60 | 延安市 | 3.90 | 池州市 | 2.43 | 石家庄市 | 3.32 | 黑河市 | 0.69 |
| 临汾市 | 4.13 | 咸宁市 | 2.31 | 开封市 | 2.97 | 沈阳市 | 4.28 | 福州市 | 3.84 | 鄂州市 | 2.52 |
| 临沂市 | 2.54 | 咸阳市 | 3.64 | 张家口市 | 2.82 | 沧州市 | 2.95 | 秦皇岛市 | 3.26 | 酒泉市 | 2.97 |
| 临沧市 | 4.16 | 哈尔滨市 | 4.19 | 张家界市 | 2.35 | 河池市 | 2.47 | 绍兴市 | 3.20 | 重庆市 | 4.22 |
| 丹东市 | 3.43 | 唐山市 | 3.23 | 张掖市 | 4.06 | 河源市 | 2.55 | 绥化市 | 0.04 | 金华市 | 2.44 |
| 丽水市 | 2.73 | 商丘市 | 2.38 | 徐州市 | 2.32 | 泉州市 | 3.10 | 绵阳市 | 2.55 | 金昌市 | 2.60 |
| 丽江市 | 3.63 | 商洛市 | 3.79 | 德州市 | 2.59 | 泰安市 | 2.35 | 聊城市 | 2.12 | 钦州市 | 1.64 |
| 黄石市 | 0.95 | 嘉兴市 | 3.24 | 德阳市 | 2.31 | 泰州市 | 2.33 | 肇庆市 | 2.39 | 铁岭市 | 1.97 |
| 乌海市 | 5.06 | 嘉峪关市 | 3.62 | 忻州市 | 5.43 | 泸州市 | 1.70 | 自贡市 | 1.82 | 铜川市 | 3.20 |
| 黄山市 | 1.16 | 四平市 | 3.39 | 怀化市 | 3.34 | 洛阳市 | 3.09 | 舟山市 | 3.39 | 铜陵市 | 1.42 |
| 乐山市 | 2.80 | 固原市 | 4.27 | 成都市 | 4.57 | 济南市 | 3.97 | 芜湖市 | 2.24 | 银川市 | 3.02 |
| 九江市 | 2.90 | 大同市 | 4.17 | 扬州市 | 2.62 | 济宁市 | 2.66 | 苏州市 | 4.54 | 锦州市 | 2.19 |
| 云浮市 | 2.07 | 大庆市 | 4.45 | 承德市 | 3.14 | 海口市 | 3.82 | 茂名市 | 1.79 | 镇江市 | 2.26 |
| 亳州市 | 1.82 | 大连市 | 4.19 | 抚州市 | 2.49 | 淄博市 | 3.23 | 荆州市 | 1.85 | 长春市 | 2.95 |
| 伊春市 | 3.12 | 天水市 | 3.41 | 抚顺市 | 3.17 | 淮北市 | 2.74 | 荆门市 | 2.24 | 长沙市 | 3.70 |
| 佛山市 | 4.49 | 天津市 | 5.05 | 揭阳市 | 1.70 | 淮南市 | 1.88 | 莆田市 | 2.35 | 长治市 | 2.81 |
| 佳木斯市 | 3.16 | 太原市 | 5.19 | 攀枝花市 | 3.92 | 淮安市 | 1.95 | 萍乡市 | 2.46 | 阜新市 | 1.89 |
| 保定市 | 2.98 | 威海市 | 3.34 | 新乡市 | 2.89 | 深圳市 | 10.95 | 营口市 | 2.52 | 阜阳市 | 1.23 |
| 保山市 | 3.21 | 娄底市 | 2.56 | 新余市 | 2.38 | 清远市 | 2.21 | 葫芦岛市 | 2.70 | 防城港市 | 2.21 |
| 信阳市 | 2.05 | 孝感市 | 2.08 | 无锡市 | 4.11 | 温州市 | 3.46 | 蚌埠市 | 2.37 | 阳江市 | 1.27 |
| 黄冈市 | 0.81 | 宁德市 | 2.62 | 日照市 | 2.30 | 渭南市 | 2.88 | 衡水市 | 2.59 | 阳泉市 | 2.57 |
| 六安市 | 2.55 | 宁波市 | 4.36 | 昆明市 | 5.07 | 湖州市 | 2.92 | 衡阳市 | 2.61 | 随州市 | 1.17 |
| 六盘水市 | 2.49 | 安庆市 | 2.99 | 昭通市 | 2.16 | 湘潭市 | 3.02 | 衢州市 | 2.29 | 雅安市 | 1.70 |
| 兰州市 | 4.36 | 安康市 | 3.07 | 晋中市 | 4.00 | 湛江市 | 2.06 | 西宁市 | 3.70 | 青岛市 | 3.07 |
| 内江市 | 2.02 | 安阳市 | 2.72 | 晋城市 | 4.47 | 滁州市 | 2.24 | 西安市 | 4.24 | 鞍山市 | 1.92 |
| 包头市 | 3.75 | 安顺市 | 2.20 | 景德镇市 | 3.03 | 滨州市 | 2.50 | 许昌市 | 2.45 | 韶关市 | 1.41 |
| 北京市 | 8.92 | 定西市 | 3.08 | 曲靖市 | 2.36 | 漯河市 | 2.40 | 贵港市 | 1.49 | 马鞍山市 | 1.19 |
| 北海市 | 2.75 | 宜宾市 | 2.44 | 朔州市 | 3.65 | 漳州市 | 2.66 | 贵阳市 | 3.78 | 驻马店市 | 0.96 |
| 十堰市 | 3.53 | 宜昌市 | 2.98 | 朝阳市 | 2.66 | 潍坊市 | 2.98 | 贺州市 | 1.91 | 鸡西市 | 1.36 |
| 南京市 | 4.98 | 宜春市 | 2.19 | 本溪市 | 3.20 | 潮州市 | 2.43 | 资阳市 | 2.18 | 鹤壁市 | 1.17 |
| 南充市 | 1.83 | 宝鸡市 | 3.30 | 来宾市 | 1.93 | 濮阳市 | 2.56 | 赣州市 | 2.16 | 鹤岗市 | 1.26 |
| 南宁市 | 3.73 | 宣城市 | 2.16 | 杭州市 | 5.36 | 烟台市 | 3.11 | 赤峰市 | 2.41 | 巴彦淖尔市 | 2.59 |
| 南平市 | 2.71 | 宿州市 | 1.85 | 松原市 | 3.05 | 焦作市 | 2.68 | 辽源市 | 3.19 | 克拉玛依市 | 5.66 |
| 南昌市 | 3.58 | 宿迁市 | 1.69 | 枣庄市 | 2.41 | 牡丹江市 | 3.00 | 辽阳市 | 2.76 | 乌鲁木齐市 | 5.73 |
| 南通市 | 2.74 | 岳阳市 | 2.74 | 柳州市 | 3.34 | 玉林市 | 1.78 | 达州市 | 2.06 | 乌兰察布市 | 2.36 |
| 南阳市 | 2.54 | 崇左市 | 2.21 | 株洲市 | 2.95 | 玉溪市 | 2.96 | 运城市 | 3.00 | 鄂尔多斯市 | 3.62 |
| 厦门市 | 4.91 | 巴中市 | 1.63 | 桂林市 | 2.92 | 珠海市 | 4.56 | 连云港市 | 1.85 | 齐齐哈尔市 | 0.92 |
| 梧州市 | 2.30 | 鹰潭市 | 0.97 | 梅州市 | 2.52 | 白城市 | 3.34 | 通化市 | 2.63 | 呼和浩特市 | 3.98 |
表3 公共服务产品供给和创新水平的全局自相关检验Tab.3 Global autocorrelation tests of public service product supply and urban innovation level |
| 年份 | 创新水平的莫兰检验 | 公共服务产品供给莫兰检验 | |
|---|---|---|---|
| 2003 | 0.178 | 0.313 | |
| 2004 | 0.205 | 0.322 | |
| 2005 | 0.221 | 0.300 | |
| 2006 | 0.217 | 0.315 | |
| 2007 | 0.227 | 0.254 | |
| 2008 | 0.224 | 0.289 | |
| 2009 | 0.265 | 0.199 | |
| 2010 | 0.283 | 0.253 | |
| 2011 | 0.299 | 0.214 | |
| 2012 | 0.313 | 0.243 | |
| 2013 | 0.321 | 0.232 | |
| 2014 | 0.328 | 0.221 | |
| 2015 | 0.341 | 0.209 | |
| 2016 | 0.354 | 0.237 | |
| 2017 | 0.361 | 0.215 | |
| 2018 | 0.374 | 0.263 | |
| 2019 | 0.378 | 0.258 |
表4 空间杜宾模型回归结果Tab.4 Regression results of spatial Durbin model |
| 解释变量 | x | Wx | |
|---|---|---|---|
| lnpscore | 0.123***(3.69) | 0.369***(6.54) | |
| lnn | 0.112***(3.56) | 0.409***(8.92) | |
| lngdp | -0.033***(-3.52) | -0.002(-0.24) | |
| lnpop_den | 0.005(0.34) | -0.033(-1.16) | |
| lnfoe | 0.009*(1.65) | -0.024**(-2.58) | |
| lnqua | 0.061***(4.33) | 0.079***(3.45) | |
| lnM | 0.005(0.59) | -0.042***(-3.08) | |
| 个体效应 | 是 | ||
| 时间效应 | 是 | ||
| rho | 0.373***(23.09) | ||
| sigma2_e | 0.120***(43.86) | ||
| N | 4692 | ||
表5 空间效应分解结果Tab.5 Results of spatial effect decomposition |
| 变量 | 直接效应 | 间接效应 | 总效应 |
|---|---|---|---|
| lnpscore | 0.162***(5.03) | 0.614***(8.01) | 0.776***(9.06) |
| lnn | 0.156***(4.92) | 0.657***(11.34) | 0.813***(12.63) |
| lngdp | -0.033***(-3.63) | -0.021(-1.45) | -0.054***(-2.82) |
| lnpop_den | 0.002(0.12) | -0.047(-1.18) | -0.045(-1.04) |
| lnfoe | 0.007(1.36) | -0.029**(-2.15) | -0.022(-1.48) |
| lnqua | 0.071***(5.14) | 0.146***(4.86) | 0.217***(6.36) |
| lnM | 0.001(0.09) | -0.058***(-2.80) | -0.057**(-2.29) |
表6 财政支出的调节效应结果Tab.6 Results of the moderating effect of fiscal expenditure |
| 解释变量 | x | Wx |
|---|---|---|
| lnp_f | 0.028***(3.89) | 0.063***(5.54) |
| lnfinexp | 0.128***(11.51) | 0.137***(8.60) |
| lnpscore | 0.123***(3.69) | 0.369***(6.54) |
| lnn | 0.120***(3.88) | 0.339***(7.42) |
| lngdp | -0.037***(-3.95) | 0.006(0.60) |
| lnpop_den | 0.016(1.11) | -0.004(-0.15) |
| lnfoe | 0.004(0.80) | -0.039**(-4.20) |
| lnqua | 0.027*(1.92) | 0.004(0.17) |
| lnM | 0.013*(1.71) | -0.021(-1.58) |
| 个体效应 | 是 | |
| 时间效应 | 是 | |
| rho | 0.278***(15.62) | |
| sigma2_e | 0.124***(47.20) | |
| N | 4692 | |
表7 分地区的直接效应和间接效应估计结果Tab.7 Estimation results of direct and indirect effects in different regions |
| 变量名称 | 东部地区 | 中西部地区 | |||
|---|---|---|---|---|---|
| 直接效应 | 间接效应 | 直接效应 | 间接效应 | ||
| lnpscore | 0.349*** | 1.148*** | -0.003 | 0.129 | |
| (8.10) | (9.21) | (-0.05) | (1.46) | ||
| lnn | 0.088** | 0.598*** | 0.149*** | 0.672*** | |
| (2.35) | (7.61) | (3.47) | (8.51) | ||
| lngdp | -0.049*** | -0.055*** | -0.023 | 0.008 | |
| (-4.45) | (-2.68) | (-1.56) | (0.47) | ||
| lnpop_den | 0.021 | -0.061 | -0.060* | 0.00 | |
| (1.60) | (-1.31) | (-1.74) | (0.00) | ||
| lnfoe | 0.013 | -0.044* | 0.009 | -0.003 | |
| (1.54) | (-1.85) | (1.33) | (-0.18) | ||
| lnqua | 0.054*** | 0.195*** | 0.076*** | 0.081** | |
| (3.06) | (4.03) | (3.70) | (2.25) | ||
| lnM | 0.00 | -0.057** | 0.009 | -0.047 | |
| (0.02) | (-2.25) | (0.58) | (-1.63) | ||
表8 市域规模的直接效应和间接效应估计结果Tab.8 Estimation results of direct and indirect effects in different scale of cities |
| 变量名称 | 大市域 | 中小市域 | |||
|---|---|---|---|---|---|
| 直接效应 | 间接效应 | 直接效应 | 间接效应 | ||
| lnpscore | 0.289*** | 0.712*** | -0.032 | -0.124 | |
| (6.42) | (8.10) | (-0.53) | (-1.53) | ||
| lnn | 0.143*** | 0.455*** | 0.363*** | 0.369*** | |
| (4.01) | (8.14) | (6.88) | (6.45) | ||
| lngdp | -0.030** | -0.019 | -0.029* | -0.005 | |
| (-2.36) | (-1.52) | (-1.85) | (-0.52) | ||
| lnpop_den | 0.020 | 0.018 | -0.0384*** | -0.214** | |
| (1.48) | (0.54) | (-4.66) | (-2.17) | ||
| lnfoe | 0.014* | -0.098*** | -0.001 | 0.019 | |
| (1.79) | (-6.75) | (0.02) | (1.50) | ||
| lnqua | 0.051*** | 0.195*** | 0.148*** | 0.048 | |
| (3.04) | (6.71) | (5.92) | (1.44) | ||
| lnM | 0.005 | -0.046*** | 0.028 | 0.012 | |
| (0.57) | (-2.69) | (1.12) | (0.45) | ||
| [1] |
倪鹏飞, 白晶, 杨旭. 城市创新系统的关键因素及其影响机制——基于全球436个城市数据的结构化方程模型[J]. 中国工业经济, 2011(2):16-25.
|
| [2] |
谢科范, 张诗雨, 刘骅. 重点城市创新能力比较分析[J]. 管理世界, 2009(1):176-177.
|
| [3] |
赵星, 王林辉. 中国城市创新集聚空间演化特征及影响因素研究[J]. 经济学家, 2020(9):75-84.
|
| [4] |
王俊松, 颜燕, 胡曙虹. 中国城市技术创新能力的空间特征及影响因素——基于空间面板数据模型的研究[J]. 地理科学, 2017, 37(1):11-18.
|
| [5] |
赵思萌, 赵作权, 赵紫威. 中国技术创新的大规模空间集聚与趋势[J]. 经济地理, 2023, 43(11):126-134.
|
| [6] |
吕拉昌, 梁政骥, 黄茹. 中国主要城市间的创新联系研究[J]. 地理科学, 2015, 35(1):30-37.
|
| [7] |
|
| [8] |
|
| [9] |
闫东升, 孙伟, 李平星, 等. 长三角一体化区域扩容的城市创新发展效应研究[J]. 地理研究, 2022, 41(9):2568-2586.
|
| [10] |
方远平, 毕斗斗, 陈宏洋, 等. 知识密集型服务业集聚对城市群旅游创新影响的空间效应[J]. 地理学报, 2021, 76(6):1521-1536.
|
| [11] |
徐子尧, 张莉沙, 刘益志. 数字普惠金融提升了区域创新能力吗[J]. 财经科学, 2020(11):17-28.
|
| [12] |
侯新烁, 刘萍. 数字基础设施建设如何影响城市创新?——基于“宽带中国”战略的准自然实验[J]. 湘潭大学学报:哲学社会科学版, 2023, 47(1):37-44.
|
| [13] |
王文姬, 王冉. 公共文化服务如何提升城市创新能力?——来自中国城市的经验证据[J]. 学习与探索, 2022(9):157-164.
|
| [14] |
陈丛波, 叶阿忠, 陈娟. 信息通信技术对城市创新产出的影响[J]. 经济地理, 2022, 42(10):92-99,168.
|
| [15] |
|
| [16] |
|
| [17] |
|
| [18] |
宋美喆, 刘寒波. 公共服务产品供给对区域创新要素的影响[J]. 统计与决策, 2020, 36(17):176-180.
|
| [19] |
|
| [20] |
王佃利, 王玉龙, 苟晓曼. 区域公共物品视角下的城市群合作治理机制研究[J]. 中国行政管理, 2015(9):6-12.
|
| [21] |
王郁, 赵一航. 区域协同发展政策能否提高公共服务产品供给效率?——以京津冀地区为例的研究[J]. 中国人口·资源与环境, 2020, 30(8):100-109.
|
| [22] |
刘晔, 黄翠盈, 李晴, 等. 2000—2020年中国高学历人才分布格局及其影响因素研究[J]. 地理研究, 2023, 42(11):2827-2844.
|
| [23] |
韩峰, 李玉双. 产业集聚、公共服务产品供给与城市规模扩张[J]. 经济研究, 2019, 54(11):149-164.
|
| [24] |
詹新宇, 王蓉蓉. 财政压力、支出结构与公共服务质量——基于中国229个地级市面板数据的实证分析[J]. 改革, 2022(2):111-126.
|
| [25] |
刘志铭. 我国公共物品的政府提供机制及改革[J]. 经济纵横, 2003(11):29-32.
|
| [26] |
张海星, 罗丹. 财政科技支出对城市创新的影响:效应与机制[J]. 财经问题研究, 2024(3):67-80.
|
| [27] |
潘爽, 叶德珠, 叶显. 数字金融普惠了吗——来自城市创新的经验证据[J]. 经济学家, 2021(3):101-111.
|
| [28] |
刘烨, 王琦, 班元浩. 虚拟集聚、知识结构与中国城市创新[J]. 财贸经济, 2023, 44(4):89-105.
|
| [29] |
马昊, 曾小溪. 我国基本公共服务均等化的评价指标体系构建——基于东中西部代表省份的实证研究[J]. 江汉论坛, 2011(11):23-25.
|
| [30] |
辛冲冲, 陈志勇. 中国基本公共服务产品供给水平分布动态、地区差异及收敛性[J]. 数量经济技术经济研究, 2019, 36(8):52-71.
|
| [31] |
吴海军, 杨其静, 阳镇. 生产性政府债务与城市创新力——基于中国城市面板数据的经验研究[J]. 中国工业经济, 2023(10):42-60.
|
| [32] |
|
| [33] |
郑适, 秦明, 樊林峰, 等. 最低工资、空间溢出与非农就业——基于空间杜宾模型的分析[J]. 财贸经济, 2016(12):133-143.
|
| [34] |
|
/
| 〈 |
|
〉 |
