
Spatial Disequilibrium and Impact Effects of Digital Construction in Hunan Province
Received date: 2024-01-13
Revised date: 2024-05-10
Online published: 2024-09-14
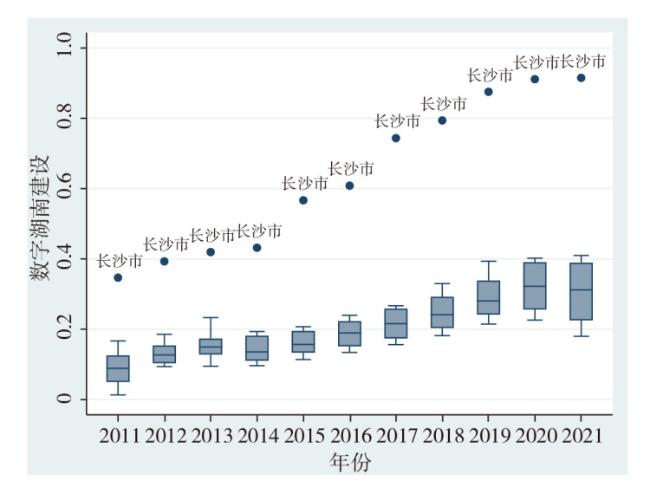
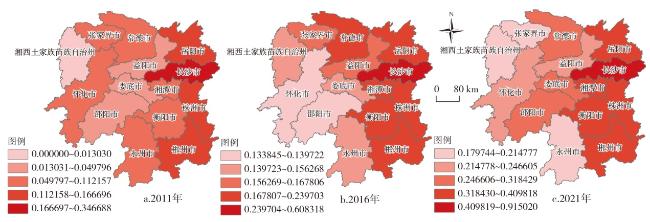
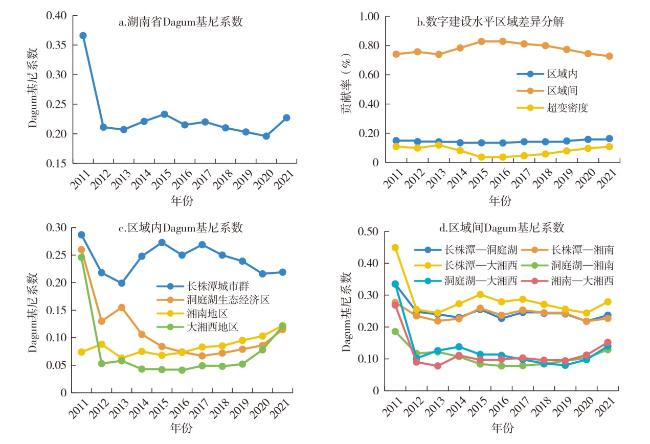
Digital Hunan construction serves as a pivotal strategy for fostering new quality productive forces in Hunan Province. Using the panel data of 14 cities (prefectures) in Hunan Province from 2011 to 2021,this study constructs an evaluation index system for the construction of Digital Hunan from six dimensions,including digital infrastructure,digital industrialization,industrial digitization,digital innovation capability,digital government level,and digital inclusive finance. It employs box plot analysis,Gini coefficient,spatial econometric models,and spatial correlation analysis to investigate the disequilibrium characteristics and influencing factors of Digital Hunan construction.The results indicate that:1) Digital Hunan construction displays clear regional disequilibrium characteristics,forming an unbalanced development pattern "centered around a primary core and supported by peripheral corridors."2) The disequilibrium in the construction of Digital Hunan mainly stems from the differences among four major regions,which are primarily caused by the disparities between the Changsha-Zhuzhou-Xiangtan urban agglomeration and the Western Hunan region,the Changsha-Zhuzhou-Xiangtan urban agglomeration and the Dongting Lake Eco-economic Zone,as well as the Changsha-Zhuzhou-Xiangtan urban agglomeration and the Southern Hunan region.3) Factors such as economic development level and transportation infrastructure significantly enhance Digital Hunan construction,while fiscal expenditure and industrial structure pose significant negative impacts.Based on these insights,recommendations are proposed to intensify efforts in addressing digital gaps,coordinate regional development more effectively,and foster deep integration between digital and traditional economic sectors.
PENG Wenbin , XIE Xiaoqi , NING Yixuan , SU Xinyi . Spatial Disequilibrium and Impact Effects of Digital Construction in Hunan Province[J]. Economic geography, 2024 , 44(6) : 93 -101 . DOI: 10.15957/j.cnki.jjdl.2024.06.010
表1 区域数字建设水平评价指标体系Tab.1 Evaluation index system of digital Hunan construction |
| 一级指标 | 二级指标(单位) | 方向 |
|---|---|---|
| 数字基础 设施 | 每百人移动电话用户数(户/百人) | 正 |
| 每百人互联网用户数(户/百人) | 正 | |
| 数字 产业化 | 每百人电信业务收入(万元/百人) | 正 |
| 信息传输、软件和信息技术服务业投资占比(%) | 正 | |
| 信息传输、计算机服务和软件业法人单位数(个) | 正 | |
| 产业 数字化 | 信息传输、软件和信息技术服务业增加值(亿元) | 正 |
| 信息传输、软件和信息技术服务业新增固定资产(亿元) | 正 | |
| 数字 创新能力 | 每万人数字经济相关有效发明专利数(件/万人) | 正 |
| 信息传输、计算机服务和软件业从业人员(人) | 正 | |
| R&D人员(人) | 正 | |
| R&D经费支出(万元) | 正 | |
| 数字政府 水平 | 电子信息公开程度 | 正 |
| 在线服务深度 | 正 | |
| 公众参与程度 | 正 | |
| 用户体验满意度 | 正 | |
| 数字 普惠金融 | 数字普惠金融覆盖广度 | 正 |
| 数字普惠金融使用深度 | 正 | |
| 数字普惠金融数字化程度 | 正 |
表2 数字湖南建设水平四大区域Dagum基尼系数Tab.2 Dagum Gini coefficient of digital Hunan construction level in four major regions |
| 年份 | 总体 | 区域内 | 区域间 | 贡献率(%) | ||||||||||||
|---|---|---|---|---|---|---|---|---|---|---|---|---|---|---|---|---|
| 1 | 2 | 3 | 4 | 1-2 | 1-3 | 1-4 | 2-3 | 2-4 | 3-4 | 区域内 | 区域间 | 超变密度 | ||||
| 2011 | 0.366 | 0.287 | 0.260 | 0.074 | 0.246 | 0.335 | 0.277 | 0.449 | 0.186 | 0.335 | 0.269 | 14.981 | 74.100 | 10.919 | ||
| 2012 | 0.211 | 0.218 | 0.130 | 0.088 | 0.053 | 0.248 | 0.235 | 0.255 | 0.117 | 0.102 | 0.090 | 14.348 | 75.705 | 9.947 | ||
| 2013 | 0.207 | 0.199 | 0.155 | 0.063 | 0.058 | 0.240 | 0.219 | 0.244 | 0.122 | 0.126 | 0.078 | 14.146 | 73.939 | 11.914 | ||
| 2014 | 0.221 | 0.248 | 0.106 | 0.075 | 0.043 | 0.230 | 0.226 | 0.273 | 0.107 | 0.138 | 0.111 | 13.500 | 78.350 | 8.151 | ||
| 2015 | 0.233 | 0.273 | 0.084 | 0.068 | 0.042 | 0.255 | 0.259 | 0.302 | 0.084 | 0.114 | 0.097 | 13.493 | 82.791 | 3.717 | ||
| 2016 | 0.215 | 0.250 | 0.074 | 0.073 | 0.041 | 0.227 | 0.237 | 0.279 | 0.078 | 0.111 | 0.099 | 13.389 | 82.901 | 3.710 | ||
| 2017 | 0.220 | 0.269 | 0.067 | 0.083 | 0.049 | 0.246 | 0.253 | 0.287 | 0.079 | 0.098 | 0.103 | 14.208 | 81.116 | 4.676 | ||
| 2018 | 0.210 | 0.250 | 0.072 | 0.085 | 0.048 | 0.243 | 0.245 | 0.271 | 0.084 | 0.086 | 0.096 | 14.212 | 79.943 | 5.845 | ||
| 2019 | 0.203 | 0.239 | 0.079 | 0.095 | 0.052 | 0.241 | 0.243 | 0.256 | 0.094 | 0.080 | 0.094 | 14.730 | 77.302 | 7.968 | ||
| 2020 | 0.196 | 0.216 | 0.086 | 0.103 | 0.078 | 0.218 | 0.218 | 0.244 | 0.103 | 0.098 | 0.112 | 15.833 | 74.468 | 9.700 | ||
| 2021 | 0.227 | 0.219 | 0.115 | 0.122 | 0.121 | 0.237 | 0.227 | 0.279 | 0.129 | 0.140 | 0.152 | 16.453 | 72.712 | 10.835 | ||
| 均值 | 0.228 | 0.243 | 0.112 | 0.084 | 0.076 | 0.247 | 0.240 | 0.285 | 0.108 | 0.130 | 0.118 | 14.481 | 77.575 | 7.944 | ||
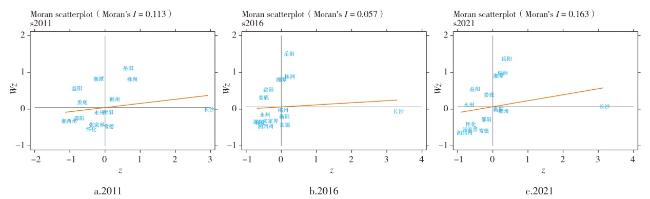
表3 数字湖南建设全域空间自相关Tab.3 Global spatial autocorrelation of the level of digital Hunan construction |
| 年份 | 2011 | 2012 | 2013 | 2014 | 2015 | 2016 | 2017 | 2018 | 2019 | 2020 | 2021 |
|---|---|---|---|---|---|---|---|---|---|---|---|
| Moran′s I | 0.113 | 0.069 | 0.072 | 0.064 | 0.031 | 0.057 | 0.04 | 0.071 | 0.091 | 0.122 | 0.163 |
| 标准差 | 0.128 | 0.096 | 0.112 | 0.102 | 0.078 | 0.084 | 0.074 | 0.08 | 0.085 | 0.094 | 0.106 |
| Z值 | 1.484 | 1.517 | 1.325 | 1.38 | 1.393 | 1.59 | 1.573 | 1.854 | 1.977 | 2.118 | 2.269 |
| P值 | 0.069 | 0.065 | 0.093 | 0.084 | 0.082 | 0.056 | 0.058 | 0.032 | 0.024 | 0.017 | 0.012 |
表4 空间杜宾回归结果Tab.4 Results of spatial Durbin regression |
| 变量 | (1) Sdm Main | (2) Wx | (3) Spatial | (4) Variance | (5) LR_Direct | (6) LR_Indirect | (7) LR_Total |
|---|---|---|---|---|---|---|---|
| lnG | 0.178***(0.056 ) | -0.036(0.058) | 0.186***(0.053) | 0.066(0.058) | 0.252***(0.039) | ||
| lnF | -0.309*(0.169) | -0.369(0.232) | -0.380**(0.155) | -0.804***(0.269) | -1.184***(0.254) | ||
| lnT | 0.336***(0.091) | -1.091***(0.221) | 0.211**(0.087) | -1.567***( 0.384) | -1.355***(0.414) | ||
| lnI | -0.576***(0.106) | -0.175(0.158) | -0.636***(0.104) | -0.692***(0.226) | -1.327***(0.241) | ||
| rho | 0.430***(0.081) | ||||||
| R2 | 0.706 | ||||||
| 样本量 | 154 | 154 | 154 | 154 | 154 | 154 | 154 |
注:*、**、***分别表示在10%、5%、1%的水平下显著;括号内数值为标准误差。表5同。 |
表5 稳健性检验结果Tab.5 Robustness test results |
| 变量 | (1) Sdm Main | (2) Wx | (3) LR_Direct | (4) LR_Indirect | (5) Sdm Main | (6) Wx | (7) LR_Direct | (8) LR_Indirect |
|---|---|---|---|---|---|---|---|---|
| lnG | 0.178***(0.056) | -0.046(0.060) | 0.186***(0.054) | 0.071(0.068) | 0.156**(0.062) | 0.053(0.071) | 0.167***(0.061) | 0.231**(0.104) |
| lnF | -0.374**(0.174) | -0.295(0.242) | -0.454***(0.159) | -0.830***(0.303) | -0.245(0.170) | -0.877***(0.322) | -0.319**(0.162) | -1.789***(0.462) |
| lnT | 0.224**(0.103) | -0.983***(0.255) | 0.087(0.102) | -1.588***(0.477) | 0.073(0.092) | -1.640***(0.399) | -0.043(0.111) | -3.022***(1.047) |
| lnI | -0.640***(0.111) | -0.088(0.182) | -0.706***(0.112) | -0.705**(0.289) | -0.620***(0.119) | -0.346(0.234) | -0.670***(0.118) | -1.166***(0.406) |
| rho | 0.481***(0.082) | 0.461***(0.118) | ||||||
| R2 | 0.5753 | 0.5773 | ||||||
| 样本量 | 140 | 140 | 140 | 140 | 154 | 154 | 154 | 154 |
| [1] |
王娟, 张一, 黄晶, 等. 中国数字生态指数的测算与分析[J]. 电子政务, 2022(3):4-16.
|
| [2] |
张柯贤, 黎红梅. 城市群数字经济发展水平的空间差异及收敛分析[J]. 经济地理, 2022, 42(9):120-128.
|
| [3] |
韩兆安, 赵景峰, 吴海珍. 中国省际数字经济规模测算、非均衡性与地区差异研究[J]. 数量经济技术经济研究, 2021, 38(8):164-181.
|
| [4] |
彭文斌, 韩东初, 尹勇, 等. 京津冀地区数字经济的空间效应研究[J]. 经济地理, 2022, 42(5):136-143,232.
|
| [5] |
杨路明, 施礼. “一带一路”数字经济产业聚集发展研究[J]. 中国流通经济, 2021, 35(3):54-67.
|
| [6] |
徐君, 郭鑫, 蒋雨晨. 中国区域数字创新能力评价及空间相关性与分异性研究[J]. 软科学, 2022, 36(11):49-58.
|
| [7] |
舒季君, 周建平, 陈亦婷, 等. 中国省域数字经济的空间演化特征及其城乡融合效应[J]. 经济地理, 2022, 42(8):103-111.
|
| [8] |
王彬燕, 田俊峰, 程利莎, 等. 中国数字经济空间分异及影响因素[J] .地理科学, 2018, 38(6):859-868.
|
| [9] |
李研. 数字经济发展活力的动态演变及提升路径[J]. 地理研究, 2024, 43(2):322-339.
|
| [10] |
吕雁琴, 范天正. 中国数字经济发展的时空分异及影响因素研究[J]. 重庆大学学报:社会科学版, 2023, 29(3):47-60.
|
| [11] |
余运江, 杨力, 任会明, 等. 中国城市数字经济空间格局演化与驱动因素[J]. 地理科学, 2023, 43(3):466-475.
|
| [12] |
李娜, 张田雨, 孙毅, 等. 我国省级地区数字经济核心产业规模及其差异演变[J]. 调研世界, 2024(6):73-86.
|
| [13] |
傅贻忙, 张晨怡, 刘奎兵, 等. 数字经济发展空间关联网络结构及其驱动因素——以长江经济带为例[J]. 地域研究与开发, 2023, 42(6):20-25.
|
| [14] |
李源, 刘承良. 中国城市数字技术创新的时空演化及影响因素[J]. 地理科学, 2024, 44(5):754-765.
|
| [15] |
王胜鹏, 滕堂伟, 胡森林, 等. 中国数字经济空间网络结构演化及其驱动因素[J]. 地理科学, 2024, 44(5):743-753.
|
| [16] |
何天祥, 黄琳雅. 高铁网络对湖南区域经济协同发展影响[J]. 地理科学, 2020, 40(9):1439-1449.
|
| [17] |
|
| [18] |
张鹏. 数字经济的本质及其发展逻辑[J]. 经济学家, 2019(2):25-33.
|
| [19] |
王军, 朱杰, 罗茜. 中国数字经济发展水平及演变测度[J]. 数量经济技术经济研究, 2021, 38 (7):26-42.
|
| [20] |
赵涛, 张智, 梁上坤. 数字经济、创业活跃度与高质量发展——来自中国城市的经验证据[J]. 管理世界, 2020, 36(10):65-76.
|
| [21] |
陈贵富, 韩静, 韩恺明. 城市数字经济发展、技能偏向型技术进步与劳动力不充分就业[J]. 中国工业经济, 2022(8):118-136.
|
| [22] |
施炳展, 游安南. 数字化政府与国际贸易[J]. 财贸经济, 2021, 42(7):145-160.
|
| [23] |
焦豪. 数字平台生态观:数字经济时代的管理理论新视角[J]. 中国工业经济, 2023 (7):122-141.
|
| [24] |
陈修颖, 苗振龙. 数字经济增长动力与区域收入的空间分布规律[J]. 地理学报, 2021, 76(8):1882-1894.
|
| [25] |
张效莉, 石宇航. 交通基础设施与全国统一大市场[J]. 消费经济, 2024, 40(3):44-60.
|
| [26] |
张平, 郭建华, 肖功为. 湖南省数字经济发展水平测度及时空特征分析[J]. 湖南财政经济学院学报, 2024, 40(2):40-49.
|
| [27] |
刘修岩, 王雨昕. 数字基础设施与中国城市的空间重构[J]. 经济地理, 2024, 44(4):55-63.
|
| [28] |
邓宗兵, 肖沁霖, 王炬, 等. 中国数字经济与绿色发展耦合协调的时空特征及驱动机制[J]. 地理学报, 2024, 79(4):971-990.
|
| [29] |
张学良, 韩慧敏, 许基兰. 新型区域合作背景下省际交界区域跨越式发展研究[J]. 经济纵横, 2023(6):37-46.
|
/
| 〈 |
|
〉 |