
Accessibility and Spatial Effect of China-Mongolia-Russia High-speed Railway
Received date: 2023-09-13
Revised date: 2024-03-21
Online published: 2024-09-14
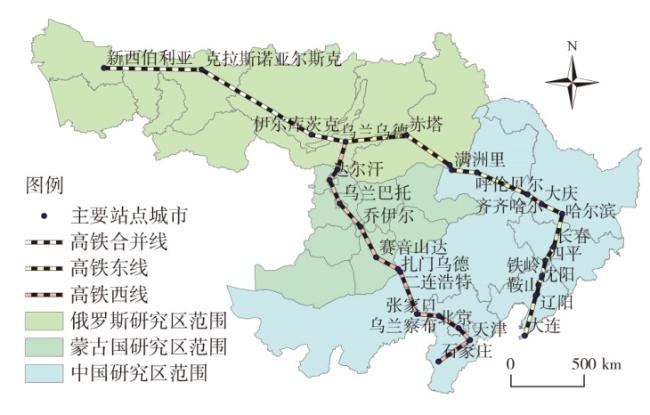
Taking the western and eastern railways of "China-Mongolia-Russia Economic Corridor"(CMREC)as research objects,this paper measures the dynamic change of urban accessibility based on the accessibility index,analyzes its spatial effect of the railway upgrade and speeding on the regions and cities along the railways. It's found that: 1) The opening of China-Mongolia-Russia high-speed railway(HSR) will greatly improve the regional and urban accessibility level along the CMREC. It will shorten the whole journey to only one day. The accessibility level and its improvement degree of the eastern railway line are stronger than that of the western railway line. 2) The accessibility level of Chinese cities is stronger than that of Russian and Mongolian cities,showing the pattern which is higher in the southeast of CMREC and lower in the northwest of CMREC. The improvement degree of urban accessibility in Mongolia is greater than that in China and Russia,showing the pattern which is higher in the middle of CMREC and lower at the beginning and end of CMREC. 3) The accessibility improvement of high-speed railways accelerates the evolution and reshaping of the pattern along the CMREC. The regional population and economic gravity centers will move to the China-Mongolia-Russia HSR axial belt,and its spatial polarization phenomenon will further enhance. The internal boundary effect of the China-Mongolia-Russia axial belt will disappear,and the integration effect of boundary areas and boundary cities will appear. The regional trade creation and transfer effects has deepened,and the scale of cross-border investment has increased along the CMREC.
CHU Nanchen , SUN Yongsheng , ZHANG Pingyu . Accessibility and Spatial Effect of China-Mongolia-Russia High-speed Railway[J]. Economic geography, 2024 , 44(6) : 13 -21 . DOI: 10.15957/j.cnki.jjdl.2024.06.002
表1 中蒙俄西线沿线城市的加权平均旅行时间与经济潜力Tab.1 Weighted average travel time and economic potential of cities along the western line of China-Mongolia-Russia railway |
| 加权平均旅行时间Ai(h) | 经济潜力Pi | |||||||
|---|---|---|---|---|---|---|---|---|
| 通车前 | 通车后 | 减少率(%) | 通车前 | 通车后 | 增加率(%) | |||
| 俄罗斯 | 新西伯利亚 | 85.0 | 22.6 | 73.4 | 66 | 224 | 241 | |
| 克拉斯诺亚尔斯克 | 73.1 | 18.9 | 74.2 | 59 | 209 | 256 | ||
| 伊尔库茨克 | 55.7 | 13.5 | 75.7 | 53 | 202 | 282 | ||
| 乌兰乌德 | 47.6 | 11.3 | 76.2 | 34 | 154 | 353 | ||
| 蒙古国 | 苏赫巴托尔 | 40.2 | 9.9 | 75.3 | 2 | 8 | 273 | |
| 达尔汗 | 37.2 | 9.5 | 74.6 | 8 | 40 | 367 | ||
| 乌兰巴托 | 32.3 | 8.1 | 75.0 | 251 | 946 | 277 | ||
| 乔伊尔 | 27.6 | 6.9 | 75.0 | 1 | 4 | 288 | ||
| 赛音山达 | 24.1 | 5.8 | 75.8 | 3 | 10 | 294 | ||
| 扎门乌德 | 20.1 | 4.7 | 76.7 | 2 | 21 | 1191 | ||
| 中国 | 二连浩特 | 14.0 | 4.6 | 67.2 | 31 | 404 | 1202 | |
| 乌兰察布 | 9.6 | 3.0 | 68.4 | 539 | 1923 | 257 | ||
| 张家口 | 5.0 | 1.6 | 68.0 | 1617 | 5460 | 238 | ||
| 北京 | 2.1 | 0.6 | 69.5 | 38727 | 111784 | 189 | ||
| 天津 | 2.6 | 1.0 | 60.3 | 12958 | 31319 | 142 | ||
| 石家庄 | 5.4 | 1.8 | 66.7 | 3644 | 9590 | 163 | ||
表2 中蒙俄东线沿线城市的加权平均旅行时间与经济潜力Tab.2 Weighted average travel time and economic potential of cities along the eastern line of China-Mongolia-Russia railway |
| 加权平均旅行时间Ai(h) | 经济潜力Pi | ||||||
|---|---|---|---|---|---|---|---|
| 通车前 | 通车后 | 减少率(%) | 通车前 | 通车后 | 增加率(%) | ||
| 俄罗斯 | 新西伯利亚 | 81.9 | 22.3 | 72.8 | 64 | 227 | 253 |
| 克拉斯诺亚尔斯克 | 70.4 | 18.6 | 73.6 | 57 | 207 | 264 | |
| 伊尔库茨克 | 53.6 | 13.3 | 75.2 | 45 | 182 | 301 | |
| 乌兰乌德 | 45.4 | 11.1 | 75.5 | 27 | 114 | 326 | |
| 赤塔 | 35.1 | 8.5 | 75.9 | 29 | 137 | 375 | |
| 外贝加尔斯克 | 25.1 | 6.3 | 75.1 | 2 | 62 | 3359 | |
| 中国 | 满洲里 | 17.7 | 6.2 | 64.9 | 90 | 1703 | 1789 |
| 呼伦贝尔 | 15.9 | 5.3 | 66.4 | 967 | 3110 | 222 | |
| 齐齐哈尔 | 9.4 | 3.8 | 59.8 | 2696 | 6813 | 153 | |
| 大庆 | 8.4 | 3.2 | 61.5 | 2446 | 5863 | 140 | |
| 哈尔滨 | 7.2 | 2.4 | 66.5 | 7771 | 19322 | 149 | |
| 长春 | 5.9 | 2.1 | 64.6 | 10998 | 27837 | 153 | |
| 四平 | 5.7 | 2.1 | 63.8 | 1748 | 4319 | 147 | |
| 铁岭 | 5.7 | 2.1 | 62.9 | 3020 | 7416 | 146 | |
| 沈阳 | 5.8 | 2.1 | 63.5 | 21234 | 47571 | 124 | |
| 辽阳 | 6.3 | 2.3 | 63.3 | 3679 | 7454 | 103 | |
| 鞍山 | 6.4 | 2.4 | 62.3 | 7072 | 13342 | 89 | |
| 大连 | 9.3 | 3.3 | 64.8 | 5170 | 14147 | 174 | |
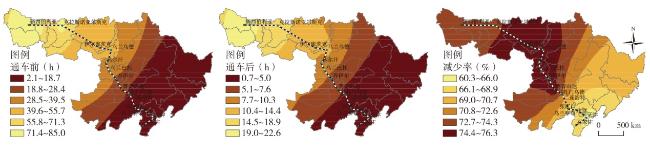
图2 中蒙俄西线加权平均旅行时间的空间格局变化Fig.2 Spatial pattern changes of the weighted average travel time along the western line of China-Mongolia-Russia railway |
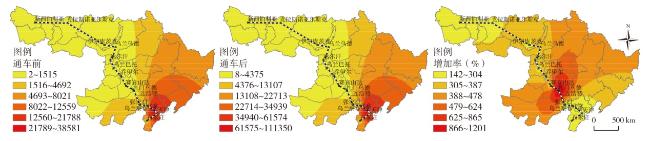
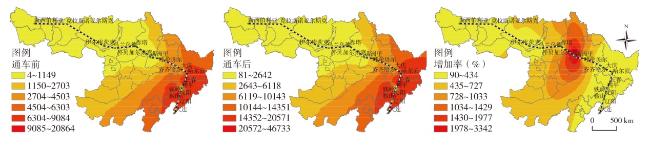
图3 中蒙俄西线经济潜力的空间格局变化Fig.3 Spatial pattern changes of the economic potential along the western line of China-Mongolia-Russia railway |
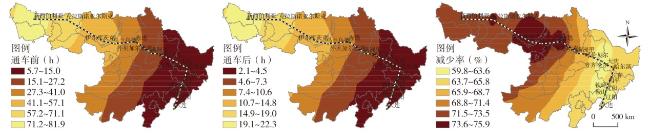
图4 中蒙俄东线加权平均旅行时间的空间格局变化Fig.4 Spatial pattern changes of the weighted average travel time along the eastern line of China-Mongolia-Russia railway |
| [1] |
|
| [2] |
|
| [3] |
|
| [4] |
|
| [5] |
王列辉, 夏伟, 宁越敏. 中国高铁城市分布格局非均衡性分析——基于与普通铁路对比的视角[J]. 城市发展研究, 2017, 24(7):68-78.
|
| [6] |
钟业喜, 黄洁, 文玉钊. 高铁对中国城市可达性格局的影响分析[J]. 地理科学, 2015, 35(4):387-395.
|
| [7] |
姜博, 初楠臣, 修春亮, 等. 中国“四纵四横”高铁网络可达性综合评估与对比[J]. 地理学报, 2016, 71(4):591-604.
|
| [8] |
|
| [9] |
蒋海兵, 祁毅, 李传武. 中国城市高速铁路客运的空间联系格局[J]. 经济地理, 2018, 38(7):26-33.
|
| [10] |
|
| [11] |
|
| [12] |
西蒙·里奇蒙德, 格雷奇·布鲁姆, 马克·迪·杜卡, 等. 西伯利亚大铁路[M]. 北京: 中国地图出版社, 2016.
|
| [13] |
赵坚. 俄罗斯铁路与大部制改革对我国的启示[J]. 综合运输, 2012(3):55-58.
|
| [14] |
|
| [15] |
|
| [16] |
刘卫东, 田锦尘, 欧晓理, 等. “一带一路”战略研究[M]. 北京: 商务印书馆, 2017.
|
| [17] |
高莎丽. 蒙古国铁路的发展[J]. 综合运输, 1996(8):36-38.
|
| [18] |
杜拉姆. 蒙古国铁路运输发展问题的研究[D]. 北京: 对外经济贸易大学, 2012.
|
| [19] |
范丽君. 中俄在蒙古国新铁路建设中的博弈[J]. 俄罗斯中亚东欧市场, 2012(6):45-52.
|
| [20] |
叶宝明. 我国东北与蒙古国铁路通道建设研究[J]. 世界地理研究, 2004(2):26-32.
|
| [21] |
通格. 蒙古国人口发展研究[D]. 长春: 吉林大学, 2012.
|
| [22] |
巴达玛. 论蒙中贸易的现状及其发展前景[D]. 长春: 吉林大学, 2013.
|
| [23] |
董锁成, 杨洋, 李富佳, 等. 中蒙俄高铁建设的影响机理及对策[J]. 地理学报, 2019, 74(2):297-311
|
| [24] |
|
| [25] |
|
| [26] |
|
| [27] |
|
| [28] |
|
| [29] |
李平华, 陆玉麒. 可达性研究的回顾与展望[J]. 地理科学进展, 2005, 24(3):69-78.
|
| [30] |
初楠臣, 张平宇. 基于可达性的中俄跨国班列沿线城市经济联系——以中俄K19/K20班列为例[J]. 经济地理, 2018, 38(6):10-18.
|
| [31] |
顾朝林, 庞海峰. 基于重力模型的中国城市体系空间联系与层域划分[J]. 地理研究, 2008, 27(1):1-12.
|
| [32] |
黄金川, 孙贵艳, 闫梅, 等. 中国城市场强格局演化及空间自相关特征[J]. 地理研究, 2012, 31(8):1355-1364.
|
| [33] |
初楠臣, 张平宇, 李鹤. 高速铁路情景下的俄罗斯远东铁路可达性及其空间效应研究[J]. 地理科学进展, 2019, 38(7):988-997.
|
/
| 〈 |
|
〉 |