
Spatio-temporal Characteristics of China's Digital Economy's Ability to Absorb and Drive Employment
Received date: 2023-08-25
Revised date: 2024-03-09
Online published: 2024-09-14
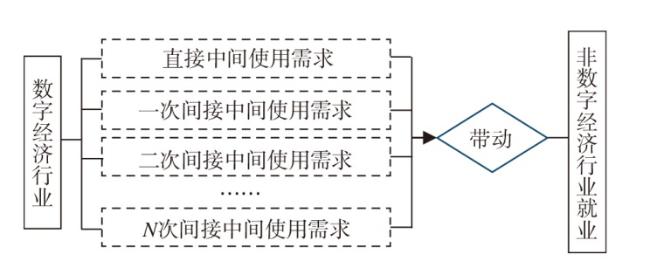
Based on the definition of core industries of digital economy by the National Bureau of Statistics of China,this article constructs a provincial input-output table including the digital economy,merges it with the provincial employment data of the national population census and the national 1% population sample survey,and analyzes the evolution trend of China's digital economy's ability to absorb and drive employment from 2000 to 2020. It's found that: 1) Digital economy's ability to absorb and drive employment have increased significantly,and the growth rate of the ability to absorb employment is even higher. 2) The digital service industry has surpassed the digital manufacturing industry and become the main industry to absorb employment. Through the continuous increase in the demand for intermediate products in the service industry,the digital economy has a constantly enhanced employment-driven effect on the leasing and business service industry,traditional wholesale and retail industries and other service industries. 3) Beijing,Tianjin,Guangzhou,Jiangsu and Shanghai have always been the advantageous areas for the digital economy to absorb and drive employment. With the penetration of the digital economy into the central and western regions,provincial-level regions in central and western China have formed new areas with ability in absorbing or driving employment. 4) The differences in the ability to absorb and drive employment of the eight comprehensive economic zones tend to narrow,and the narrowing of the differences between the three major coastal regions and the five major inland regions is the main driving force. Based on the above,this paper puts forward suggestions to strengthen employment skills training,improve the quality of employment in line with the new trend of employment in the digital economy,and improve ability to absorb and drive employment.
JIANG Yutong , FENG Yonggang . Spatio-temporal Characteristics of China's Digital Economy's Ability to Absorb and Drive Employment[J]. Economic geography, 2024 , 44(5) : 117 -125 . DOI: 10.15957/j.cnki.jjdl.2024.05.012
表1 我国数字经济就业吸纳与带动能力的变化趋势Tab.1 Change trend of China's digital economy's ability to absorb and drive employment |
| 指标名称 | 指标类别 | 2000年 | 2005年 | 2010年 | 2015年 | 2020年 |
|---|---|---|---|---|---|---|
| 就业吸纳能力 | 规模(万人) | 540.10 | 791.77 | 1576.56 | 2056.38 | 2782.42 |
| 占全国总就业比重(%) | 0.77 | 1.13 | 2.11 | 2.95 | 4.18 | |
| 就业带动能力 | 规模(万人) | 1482.01 | 1960.42 | 2073.17 | 2361.63 | 3192.32 |
| 占全国总就业比重(%) | 2.12 | 2.80 | 2.78 | 3.38 | 4.80 | |
| 就业吸纳与带动能力总和 | 规模(万人) | 2022.11 | 2752.18 | 3649.72 | 4418.02 | 5974.74 |
| 占全国总就业比重(%) | 2.89 | 3.93 | 4.89 | 6.33 | 8.98 |
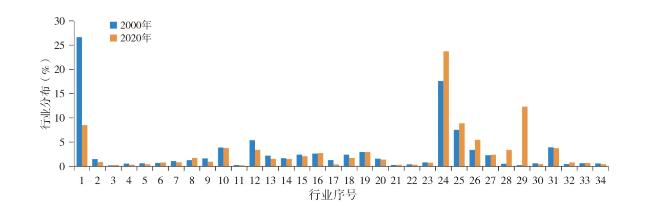
表2 我国数字经济就业吸纳能力的行业分布特征Tab.2 Industry distribution characteristics of China's digital economy's ability to absorb employment |
| 行业类别 | 2000年 | 2005年 | 2010年 | 2015年 | 2020年 |
|---|---|---|---|---|---|
| 数字产品制造业(%) | 68.76 | 54.16 | 59.61 | 56.85 | 43.94 |
| 数字产品服务业(%) | 3.98 | 4.32 | 7.16 | 9.09 | 6.95 |
| 数字技术应用业(%) | 17.47 | 34.55 | 29.21 | 28.05 | 41.40 |
| 数字要素驱动业(%) | 9.79 | 6.96 | 4.02 | 6.01 | 7.70 |
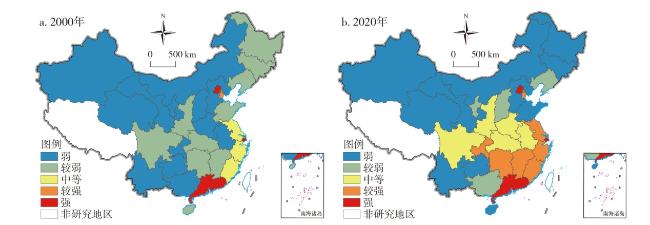
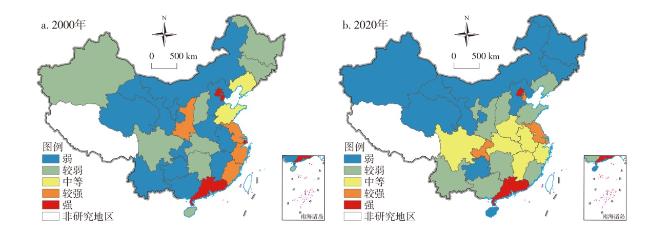
图3 我国数字经济就业吸纳能力的变化注:该图基于自然资源部标准地图服务网站下载的审图号为GS(2023)2767号的标准地图制作,底图无修改。图4、图5同。 Fig.3 Evolution characteristics of China's digital economy's ability to absorb employment |
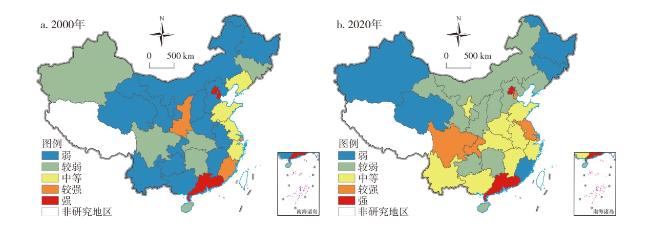
图4 我国数字经济就业带动能力的变化Fig.4 Evolution characteristics of China's digital economy's ability to drive employment |
表3 我国数字经济就业吸纳与带动能力的全局空间自相关分析Tab.3 Global spatial autocorrelation analysis of China's digital economy's ability to absorb and drive employment |
| 年份 | 就业吸纳能力 | 就业带动能力 | 就业吸纳与带动的总能力 |
|---|---|---|---|
| 2000 | 0.147* | 0.233** | 0.223** |
| 2005 | 0.296** | 0.390*** | 0.369*** |
| 2010 | 0.221** | 0.361*** | 0.315*** |
| 2015 | 0.259** | 0.251** | 0.256** |
| 2020 | 0.137* | 0.131* | 0.135* |
注:***、**和*分别表示全局空间自相关指数在1%、5%和10%水平上显著。 |
表4 就业吸纳与带动能力的Dagum基尼系数及贡献分解Tab.4 Dagum Gini coefficient and contribution decomposition of the ability to absorb and drive employment |
| 指标名称 | 年份 | Dagum 基尼系数 | 区域内差异 贡献(%) | 区域间差异贡献 | |
|---|---|---|---|---|---|
| 区域间净值 差异贡献(%) | 超变密度 贡献(%) | ||||
| 就业吸纳能力 | 2000 | 0.5548 | 6.98 | 78.32 | 14.71 |
| 2020 | 0.3090 | 8.08 | 69.43 | 22.49 | |
| 就业带动能力 | 2000 | 0.5200 | 6.87 | 75.69 | 17.44 |
| 2020 | 0.3432 | 8.62 | 69.65 | 21.72 | |
| 就业吸纳与 带动能力总和 | 2000 | 0.5254 | 6.90 | 75.94 | 17.16 |
| 2020 | 0.3163 | 8.12 | 69.10 | 22.79 | |
表5 我国八大综合经济区的区域内Dagum基尼系数Tab.5 Dagum Gini coefficient in eight comprehensive economic zones of China |
| 指标名称 | 就业吸纳能力 | 就业带动能力 | 就业吸纳与带动能力总和 | |||||
|---|---|---|---|---|---|---|---|---|
| 2000年 | 2020年 | 2000年 | 2020年 | 2000年 | 2020年 | |||
| 东北地区 | 0.1611 | 0.0785 | 0.2167 | 0.1489 | 0.2033 | 0.1116 | ||
| 北部沿海 | 0.2915 | 0.1877 | 0.1447 | 0.1778 | 0.1881 | 0.1477 | ||
| 东部沿海 | 0.4629 | 0.3708 | 0.3892 | 0.3584 | 0.4081 | 0.3635 | ||
| 南部沿海 | 0.4424 | 0.3325 | 0.2831 | 0.3821 | 0.3310 | 0.3409 | ||
| 黄河中游 | 0.0524 | 0.0748 | 0.0869 | 0.1546 | 0.0733 | 0.1142 | ||
| 长江中游 | 0.1548 | 0.1809 | 0.248 | 0.2098 | 0.2166 | 0.1967 | ||
| 西南地区 | 0.0988 | 0.0622 | 0.1999 | 0.1022 | 0.1611 | 0.0309 | ||
| 大西北地区 | 0.2217 | 0.1231 | 0.4911 | 0.1134 | 0.4436 | 0.1132 | ||
| [1] |
胡拥军, 关乐宁. 数字经济的就业创造效应与就业替代效应探究[J]. 改革, 2022(4):42-54.
|
| [2] |
|
| [3] |
|
| [4] |
蔡昉. 如何利用数字经济促进共同富裕 ?[J]. 东岳论丛, 2023, 44(3):118-124.
|
| [5] |
许宪春, 张美慧. 中国数字经济规模测算研究——基于国际比较的视角[J]. 中国工业经济, 2020(5):23-41.
|
| [6] |
蔡跃洲, 牛新星. 中国数字经济增加值规模测算及结构分析[J]. 中国社会科学, 2021(11):4-30.
|
| [7] |
王胜鹏, 滕堂伟, 夏启繁, 等. 中国数字经济发展水平时空特征及其创新驱动机制[J]. 经济地理, 2022, 42(7):33-43.
|
| [8] |
张永姣, 丁少斌, 方创琳. 中国数字经济产业发展的时空分异及空间收敛性分析——基于企业大数据的考察[J]. 经济地理, 2023, 43(3):120-130.
|
| [9] |
张亚丽, 项本武. 数字经济发展对中国市域经济韧性的影响效应[J]. 经济地理, 2023, 43(1):105-113.
|
| [10] |
姚常成, 沈凯玙. 要素流动视角下数字经济与区域经济的包容性增长效应[J]. 经济地理, 2023, 43(4):10-19.
|
| [11] |
陈建, 邹红, 张俊英. 数字经济对中国居民消费升级时空格局的影响[J]. 经济地理, 2022, 42(9):129-137.
|
| [12] |
袁冬梅, 吕书杰, 龙瑞. 数字经济发展如何影响了服务业就业?——来自微观层面的经验证据[J]. 劳动经济研究, 2023, 11(1):81-102.
|
| [13] |
|
| [14] |
|
| [15] |
|
| [16] |
|
| [17] |
岳希明. 我国现行劳动统计的问题[J]. 经济研究, 2005(3):46-56.
|
| [18] |
王亚菲, 贾雪梅, 王春云. 中国行业层面就业核算研究[J]. 统计研究, 2021, 38(12):3-18.
|
/
| 〈 |
|
〉 |