
Evaluation,Spatiotemporal Characteristics and Influencing Factors of Collaborative Development Between Digitalization and Greenization at the Provincial Level
Received date: 2023-12-07
Revised date: 2024-07-01
Online published: 2024-09-13
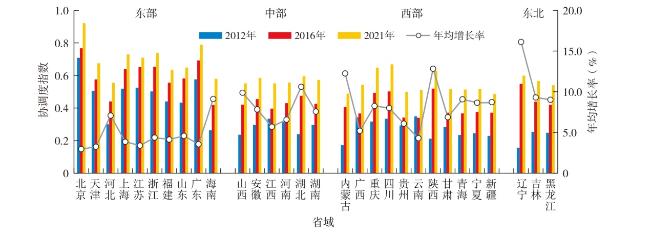
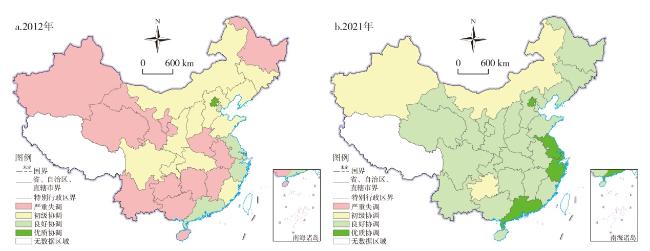
This article measures the development level of China's digitalization and greenization from 2012 to 2021,and then examines the temporal and spatial evolution characteristics of the collaborative development between digitalization and greenization and its obstacles with the help of the methods of coupling coordination degree model,Dagum Gini coefficient method,relative development degree model and obstacle degree mode. The study finds that: 1) The coordination degree between digitalization and greenization has been rising year by year during the study period,with the overall coordination level raising from primary coordination to good coordination,and substantial progress has been made in the collaborative development of digitalization and greenization. 2) With the implementation of regional coordinated development strategy,the level of the collaborative development between digitalization and greenization in China has shown a regional pattern of "the east of China leading and the west of China developing rapidly",and regional coordination has been enhanced. However,the east of China has always been in the absolute lead. The spatial pattern phenomenon has solidified,which is higher in the east of China than that in the west of China. Narrowing the differences between regions is still the key path to promoting regional collaborative development of digitalization and greenization. 3) Except for four provincial-level regions,namelyBeijing,Guangdong,Shanghai and Jiangsu,the rest of them are digitally lagging behind,and the development synchronization of digitalization and greenization is in urgent need of enhancement. 4) Cultivating digital talents,strengthening technological innovation,improving digital efficiency,and reducing energy consumption are the important focuses of the new development stage to promote the synergistic transformation and development of digitization and greening. The obstacles to the enhancement of the collaborative development level of digitalization and greenization are heterogeneous across different provincial-level regions,regional guidance and classified regulation are the key paths to the collaborative development of digitalization and greenization.
LI Xuhui , CHEN Mengwei , WANG Jingwei . Evaluation,Spatiotemporal Characteristics and Influencing Factors of Collaborative Development Between Digitalization and Greenization at the Provincial Level[J]. Economic geography, 2024 , 44(7) : 126 -134 . DOI: 10.15957/j.cnki.jjdl.2024.07.013
表1 区域数字化绿色化发展水平评价指标体系Tab.1 Evaluation index system for the development level of regional digitalization and greenization |
| 准则层 | 一级指标 | 二级指标 | 度量方式 | 综合权重 |
|---|---|---|---|---|
| 数字化 | 数字基础设施 | 移动通信部署(+) | 移动通信普及率 | 0.0695 |
| 网络基础设施(+) | 网络基础设施接入端口数/年末人口 | 0.1003 | ||
| 知识支撑 | 技术创新(+) | 每万人发明专利授权量 | 0.0703 | |
| 人才储备(+) | 数字化研究人员全时当量 | 0.0805 | ||
| 数字产业 | 研发强度(+) | 研究与试验发展经费支出/GDP | 0.0960 | |
| 数字效益(+) | 软件和信息技术服务业总收入 | 0.0920 | ||
| 绿色化 | 资源节约 | 能耗水平(-) | 能源消耗总量/GDP | 0.0878 |
| 水资源利用(-) | 用水总量/年末人口 | 0.1072 | ||
| 环境保护 | 绿化指数(+) | 绿地面积/建成区总面积 | 0.0559 | |
| 无害处理(+) | 生活垃圾无害化处理量/产生量 | 0.0734 | ||
| 低碳循环 | 碳排放水平(-) | CO2排放总量/年末人口 | 0.1144 | |
| 循环利用(+) | (危害废物利用量+处理量)/产生量 | 0.0526 |
表2 数字化绿色化协同发展的基尼系数Tab.2 Gini coefficient of the collaborative development of digitalization and greenization |
| 年份 | 总体 | 贡献率(%) | 贡献率(%) | 贡献率(%) | 东—中 | 东—西 | 中—西 | 东—东北 | 中—东北 | 西—东北 |
|---|---|---|---|---|---|---|---|---|---|---|
| 2012 | 0.1973 | 20.23 | 67.94 | 11.83 | 0.2675 | 0.2856 | 0.1226 | 0.1893 | 0.1289 | 0.1586 |
| 2013 | 0.1617 | 19.39 | 69.34 | 11.27 | 0.2332 | 0.2379 | 0.0895 | 0.1667 | 0.1049 | 0.1205 |
| 2014 | 0.1446 | 19.72 | 69.41 | 10.88 | 0.1982 | 0.2161 | 0.0820 | 0.1480 | 0.0862 | 0.1178 |
| 2015 | 0.1348 | 19.73 | 69.31 | 10.96 | 0.1853 | 0.2026 | 0.0767 | 0.1355 | 0.0786 | 0.1103 |
| 2016 | 0.1187 | 18.89 | 71.39 | 9.72 | 0.1524 | 0.1856 | 0.0749 | 0.1237 | 0.0550 | 0.0990 |
| 2017 | 0.1026 | 19.03 | 71.62 | 9.34 | 0.1386 | 0.1604 | 0.0618 | 0.1068 | 0.0454 | 0.0799 |
| 2018 | 0.0947 | 19.70 | 69.15 | 11.15 | 0.1297 | 0.1448 | 0.0565 | 0.1063 | 0.0407 | 0.0684 |
| 2019 | 0.0885 | 20.28 | 66.68 | 13.04 | 0.1203 | 0.1328 | 0.0535 | 0.1132 | 0.0305 | 0.0573 |
| 2020 | 0.0858 | 20.65 | 66.37 | 12.99 | 0.1129 | 0.1292 | 0.0529 | 0.1119 | 0.0263 | 0.0545 |
| 2021 | 0.0856 | 21.52 | 65.13 | 13.34 | 0.1049 | 0.1290 | 0.0580 | 0.1061 | 0.0217 | 0.0580 |
表3 数字化绿色化协同发展类型划分及分布Tab.3 Type division and distribution of the collaborative development of digitalization and greenization |
| 发展指数 | 协调等级 | 相对发展度 | 协调亚等级 | 省域 |
|---|---|---|---|---|
| 0.3≤D<0.5 | 初级协调 | 0<E 0.8 | 初级协调—数字落后(Ⅰ) | 河北、山西、内蒙古、吉林、黑龙江、安徽、江西、河南、湖北、湖南、广西、海南、贵州、云南、甘肃、青海、宁夏、新疆(18) |
| 0.5 D<0.7 | 良好协调 | 0<E 0.8 | 良好协调—数字落后(Ⅱ) | 浙江、福建、山东、天津、重庆、辽宁、四川、陕西(8) |
| 0.8<E 1.2 | 良好协调—同步发展(Ⅲ) | 上海、江苏、广东(3) | ||
| 0.7 D<0.1 | 优质协调 | 0.8<E 1.2 | 优质协调—同步发展(Ⅳ) | 北京(1) |
表4 中国的数字化绿色化协同发展障碍因子及障碍度(%)Tab.4 Obstacle degree and obstacle factor of the collaborative development of digitalization and greenization in China |
| 障碍因子 | 2012年 | 2015年 | 2018年 | 2021年 |
|---|---|---|---|---|
| 研发强度 | 10.55 | 10.70 | 11.53 | 11.77 |
| 数字效益 | 11.88 | 12.27 | 12.70 | 12.50 |
| 技术创新 | 9.19 | 9.81 | 10.11 | 10.60 |
| 网络基础设施 | 12.26 | 11.20 | 7.39 | 5.53 |
| 移动通信部署 | 7.62 | 6.65 | 6.68 | 6.35 |
| 人才储备 | 10.26 | 10.88 | 11.88 | 13.19 |
| 能耗水平 | 10.26 | 10.34 | 10.48 | 9.30 |
| 水资源利用 | 8.49 | 8.87 | 9.67 | 10.32 |
| 循环发展 | 5.23 | 5.71 | 6.24 | 6.62 |
| 碳排放水平 | 7.41 | 8.42 | 9.04 | 10.33 |
| 绿化指数 | 3.77 | 3.67 | 3.68 | 3.40 |
| 无害处理 | 3.07 | 1.48 | 0.59 | 0.08 |
表5 四大区域的数字化绿色化协同发展主要障碍因子及障碍度Tab.5 Obstacle degrees and main obstacle factors of the collaborative development of digitalization and greenization in four regions |
| 区域 | 1 | 2 | 3 | 4 | 5 |
|---|---|---|---|---|---|
| 东部 | 人才储备(12.26%) | 数字效益(12.10%) | 能耗水平(10.41%) | 技术创新(10.41%) | 碳排放水平(10.19%) |
| 中部 | 数字效益(13.18%) | 研发强度(11.59%) | 人才储备(11.22%) | 网络基础设施(10.31%) | 技术创新(10.02%) |
| 西部 | 数字效益(12.58%) | 研发强度(11.87%) | 人才储备(11.20%) | 网络基础设施(9.42%) | 技术创新(9.77%) |
| 东北 | 数字效益(11.91%) | 人才储备(10.89%) | 研发强度(10.83%) | 水资源利用(10.17%) | 碳排放水平(10.14%) |
注:表中第1行的1~5依次为障碍因子的排名,括号内数值为障碍度。表6同。 |
表6 四类省域的数字化绿色化协同发展主要障碍因子及障碍度Tab.6 Main obstacle factors and obstacle degrees of the collaborative development of digitalization andgreenization in four types of provincial-level regions |
| 发展类型 | 1 | 2 | 3 | 4 | 5 |
|---|---|---|---|---|---|
| Ⅰ | 数字效益(12.69%) | 研发强度(11.80%) | 人才储备(11.00%) | 人才储备(10.16%) | 技术创新(9.65%) |
| Ⅱ | 数字效益(12.82%) | 人才储备(11.95%) | 研发强度(10.91%) | 技术创新(10.68%) | 能耗水平(10.66%) |
| Ⅲ | 水资源利用(13.80%) | 碳排放水平(10.94%) | 技术创新(10.80%) | 研发强度(10.30%) | 能耗水平(10.07%) |
| Ⅳ | 人才储备(26.09%) | 数字效益(14.33%) | 无害处理(12.96%) | 能耗水平(11.07%) | 技术创新(8.31%) |
| [1] |
中国网信网. 数字化绿色化协同转型发展部际联席会议第一次会议在京召开[EB/OL]. 2022-01-22.
|
| [2] |
中国网信网. 中央网信办、国家发展改革委、工业和信息化部、生态环境部、国家能源局等5部门联合开展数字化绿色化协同转型发展(双化协同)综合试点[EB/OL]. 2022-11-17.
|
| [3] |
康芸. 加快传统产业企业数字化转型[J]. 宏观经济管理, 2022(6):82-90.
|
| [4] |
刘军, 杨渊鋆, 张三峰. 中国数字经济测度与驱动因素研究[J]. 上海经济研究, 2020(6):81-96.
|
| [5] |
李旭辉, 王经伟. 共同富裕目标下中国城乡建设绿色发展的区域差距及影响因素[J]. 自然资源学报, 2023, 38(2):419-441.
|
| [6] |
陈晓红, 李杨扬, 宋丽洁, 等. 数字经济理论体系与研究展望[J]. 管理世界, 2022, 38(2):208-224,13-16.
|
| [7] |
李旭辉, 陈梦伟. 中国乡村数字化转型:测度、区域差异及推进路径[J]. 农业经济问题, 2023(11):89-104.
|
| [8] |
潘为华, 贺正楚, 潘红玉. 中国数字经济发展的时空演化和分布动态[J]. 中国软科学, 2021(10):137-147.
|
| [9] |
万晓榆, 罗焱卿. 数字经济发展水平测度及其对全要素生产率的影响效应[J]. 改革, 2022(1):101-118.
|
| [10] |
赵涛, 张智, 梁上坤. 数字经济、创业活跃度与高质量发展——来自中国城市的经验证据[J]. 管理世界, 2020, 36(10):65-76.
|
| [11] |
魏丽莉, 侯宇琦. 数字经济对中国城市绿色发展的影响作用研究[J]. 数量经济技术经济研究, 2022, 39(8):60-79.
|
| [12] |
杨刚强, 王海森, 范恒山, 等. 数字经济的碳减排效应:理论分析与经验证据[J]. 中国工业经济, 2023(5):80-98.
|
| [13] |
卢建霖, 蒋天颖, 傅梦钰. 数字金融对绿色创新效率的影响路径[J]. 经济地理, 2023, 43(1):141-147,235.
|
| [14] |
方冬莉. 数字经济对中国城市能源利用效率的影响——基于技术赋能和技术外溢视角[J]. 资源科学, 2023, 45(2):296-307.
|
| [15] |
|
| [16] |
毛华滨, 刘苏燕. 绿色发展理念的四重维度[J]. 理论视野, 2020(1):51-55.
|
| [17] |
彭定洪, 李旭锋. 资源型城市绿色转型成效评价研究——以云南省为例[J]. 城市问题, 2023(7):21-32,52.
|
| [18] |
任嘉敏, 郭付友, 赵宏波, 等. 黄河流域资源型城市工业绿色转型绩效评价及时空异质性特征[J]. 中国人口·资源与环境, 2023, 33(6):151-160.
|
| [19] |
张友国, 窦若愚, 白羽洁. 中国绿色低碳循环发展经济体系建设水平测度[J]. 数量经济技术经济研究, 2020, 37(8):83-102.
|
| [20] |
戴翔, 杨双至. 数字赋能、数字投入来源与制造业绿色化转型[J]. 中国工业经济, 2022(9):83-101.
|
| [21] |
蔺鹏, 孟娜娜. 新型数字基础设施建设对中国工业绿色发展效率增长的影响研究[J]. 科研管理, 2023, 44(12):50-60.
|
| [22] |
杜克锐, 欧阳晓灵, 郑泳薇. 环境规制是否促进我国城市的绿色经济增长?[J]. 统计研究, 2023, 40(12):39-49.
|
| [23] |
赵杨, 王京, 潘为华. 中国省域新型城镇化水平与绿色发展水平的区域特征及其影响机制[J]. 经济地理, 2023, 43(9):1-9.
|
| [24] |
刘敏楼, 黄旭, 孙俊. 数字金融对绿色发展的影响机制[J]. 中国人口·资源与环境, 2022, 32(6):113-122.
|
| [25] |
赵卉心, 孟煜杰. 中国城市数字经济与绿色技术创新耦合协调测度与评价[J]. 中国软科学, 2022(9):97-107.
|
| [26] |
王军, 朱杰, 罗茜. 中国数字经济发展水平及演变测度[J]. 数量经济技术经济研究, 2021, 38(7):26-42.
|
| [27] |
伦晓波, 刘颜. 数字政府、数字经济与绿色技术创新[J]. 山西财经大学学报, 2022, 44(4):1-13.
|
| [28] |
许宪春, 张美慧. 中国数字经济规模测算研究——基于国际比较的视角[J]. 中国工业经济, 2020(5):23-41.
|
| [29] |
秦书生, 杨硕. 习近平的绿色发展思想探析[J]. 理论学刊, 2015(6):4-11.
|
| [30] |
潘爱玲, 刘昕, 邱金龙, 等. 媒体压力下的绿色并购能否促使重污染企业实现实质性转型[J]. 中国工业经济, 2019(2):174-192.
|
| [31] |
尹西明, 陈泰伦, 金珺, 等. 数字基础设施如何促进区域高质量发展:基于中国279个地级市的实证研究[J]. 中国软科学, 2023(12):90-101.
|
| [32] |
|
/
| 〈 |
|
〉 |