
Temporal and Spatial Pattern Evolution of China's Digital Innovation and Multidimensional Analysis of Driving Forces:From the Perspective of Digital Economy Patent Application
Received date: 2024-01-15
Revised date: 2024-07-10
Online published: 2024-09-13
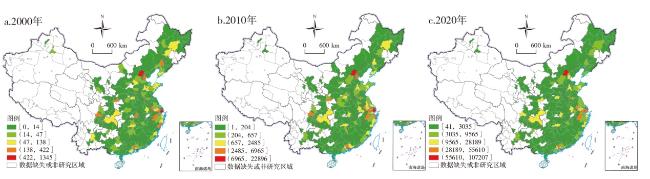
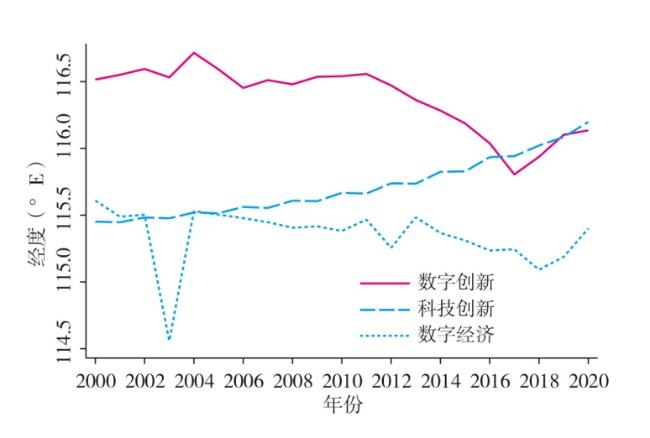
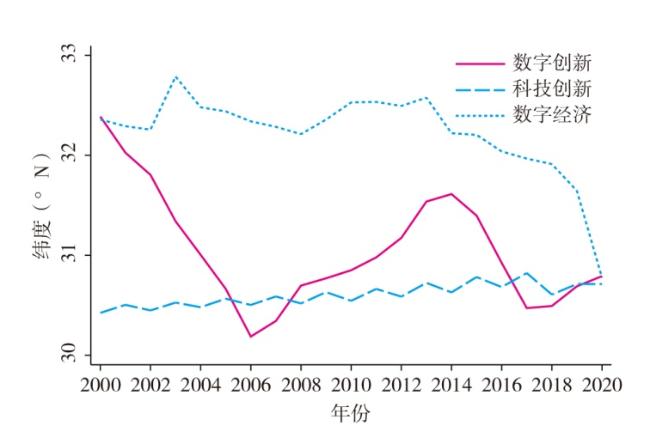
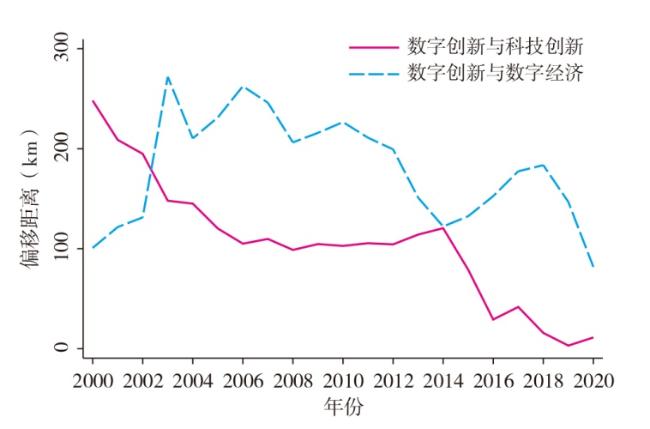
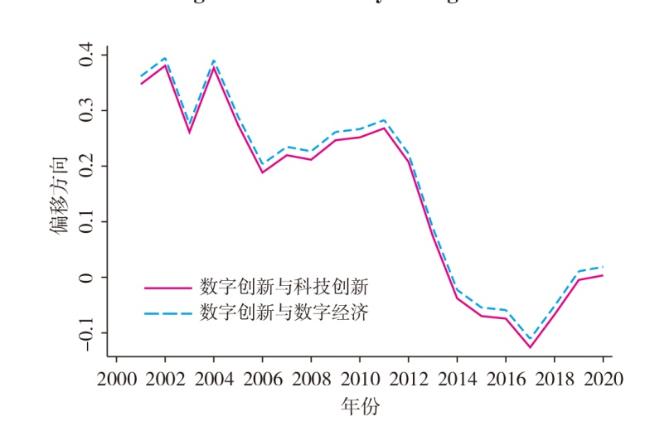
Based on the panel data of 251 cities in China from 2000 to 2020,this paper studies the spatial-temporal pattern evolution and driving factors of digital innovation in China with the help of the center of gravity model,standard deviation ellipse and the dynamic spatial panel Durbin model based on common factors. The results show that: 1) the spatial distribution of digital innovation in China is "strong in south and weak in north,high in east and low in west",and the imbalance in east and west is less than that in south and north;The spatial distribution of digital innovation in the northern region showed a "linear-flattening-shrinking" pattern,while that in the southern region showed a "multi-point-circular-expanding" pattern. 2) Digital innovation has strong temporal and spatial correlation with technological innovation and digital economy. Among them,the southern region and the central and eastern region are more sensitive to the development of national digital innovation. 3) Digital innovation has a technology locking effect in time,and digital innovation in the previous period has a negative impact on the current period. In addition to financial development,factors such as human capital,firmsize,marketcompetition,consumerdemand,big data resources and government support have greater short-term effects than long-term effects on digital innovation. 4) Human capital,firmsize,market competition and financial development have a driving effect on digital innovation in the city and neighboring cities;Big data resources and government support can promote the development of digital innovation in the local city,but can inhibit the neighboring city. However,the consumption demand has a restraining effect on the city and the neighboring city.
LI Junjie , ZHOU Minliang . Temporal and Spatial Pattern Evolution of China's Digital Innovation and Multidimensional Analysis of Driving Forces:From the Perspective of Digital Economy Patent Application[J]. Economic geography, 2024 , 44(7) : 106 -116 . DOI: 10.15957/j.cnki.jjdl.2024.07.011
表1 2000—2020年中国南北地区数字创新的标准差椭圆参数Tab.1 Standard deviation ellipse parameters of digital innovation in North and South China from 2000 to 2020 |
| 区域 | 年份 | 经度 (°E) | 纬度 (°N) | 椭圆面积 (万km2) | 长半轴 (km) | 短半轴 (km) | 形状 指数 | 旋转角度 (°) |
|---|---|---|---|---|---|---|---|---|
| 北方地区 | 2000 | 117.34 | 39.49 | 78.88 | 681.10 | 368.68 | 0.54 | 51.76 |
| 2005 | 117.22 | 39.41 | 56.46 | 595.83 | 301.66 | 0.51 | 47.29 | |
| 2010 | 116.48 | 38.73 | 65.57 | 633.70 | 329.37 | 0.52 | 47.41 | |
| 2015 | 116.67 | 38.96 | 64.19 | 607.20 | 336.55 | 0.55 | 47.46 | |
| 2020 | 116.25 | 38.55 | 71.63 | 629.72 | 362.12 | 0.58 | 50.56 | |
| 南方地区 | 2000 | 115.99 | 27.99 | 115.04 | 741.73 | 493.72 | 0.67 | 45.67 |
| 2005 | 116.30 | 27.04 | 95.71 | 398.63 | 764.37 | 1.92 | 32.93 | |
| 2010 | 116.56 | 27.88 | 105.41 | 447.99 | 749.01 | 1.67 | 35.58 | |
| 2015 | 115.99 | 28.27 | 117.70 | 732.86 | 511.27 | 0.70 | 46.24 | |
| 2020 | 116.08 | 28.10 | 108.08 | 469.92 | 732.17 | 1.56 | 37.49 |
表2 空间杜宾模型适用性检验结果Tab.2 Applicability test results of spatial Durbin model |
| 检验类型 | 统计量值 | P值 |
|---|---|---|
| LM_spatial_lag | 775.4855 | 0.0000 |
| Robust_LM_spatial_lag | 479.9216 | 0.0000 |
| LM_spatial_error | 4617.7373 | 0.0000 |
| Robust_LM_spatial_error | 4322.1734 | 0.0000 |
| LR_spatial_lag | 139.2200 | 0.0000 |
| Wald_spatial_lag | 147.1100 | 0.0000 |
| LR_spatial_error | 139.2200 | 0.0000 |
| Wald_spatial_error | 168.6000 | 0.0000 |
| Hausman Test | 112.6400 | 0.0000 |
| LR_both_ind | 318.6900 | 0.0000 |
| LR_both_time | 5257.5500 | 0.0000 |
表3 中国市域数字创新对共同因子的敏感性参数及各省份分布数量Tab.3 Sensitivity parameters of urban digital innovation to common factors Distribution number of provinces |
| 样本 省份 | 样本市域 数量(个) | ζ>1 | ζ<1 | 样本 省份 | 样本市域 数量(个) | ζ>1 | ζ<1 | |||||
|---|---|---|---|---|---|---|---|---|---|---|---|---|
| 市域 数量(个) | 市域 占比(%) | 市域 数量(个) | 市域 占比(%) | 市域 数量(个) | 市域 占比(%) | 市域 数量(个) | 市域 占比(%) | |||||
| 北京 | 1 | 1 | 100.00 | 0 | 0.00 | 江西 | 11 | 11 | 100.00 | 0 | 0.00 | |
| 天津 | 1 | 1 | 100.00 | 0 | 0.00 | 河南 | 17 | 11 | 64.71 | 6 | 35.29 | |
| 河北 | 11 | 4 | 36.36 | 7 | 63.64 | 湖北 | 12 | 8 | 66.67 | 4 | 33.33 | |
| 上海 | 1 | 1 | 100.00 | 0 | 0.00 | 湖南 | 12 | 2 | 16.67 | 10 | 83.33 | |
| 江苏 | 13 | 13 | 100.00 | 0 | 0.00 | 内蒙古 | 5 | 1 | 20.00 | 4 | 80.00 | |
| 浙江 | 11 | 9 | 81.82 | 2 | 18.18 | 广西 | 12 | 7 | 58.33 | 5 | 41.67 | |
| 福建 | 9 | 8 | 88.89 | 1 | 11.11 | 重庆 | 1 | 1 | 100.00 | 0 | 0.00 | |
| 山东 | 16 | 11 | 68.75 | 5 | 31.25 | 四川 | 15 | 7 | 46.67 | 8 | 53.33 | |
| 广东 | 21 | 11 | 52.38 | 10 | 47.62 | 贵州 | 5 | 5 | 100.00 | 0 | 0.00 | |
| 海南 | 2 | 0 | 0.00 | 2 | 100.00 | 云南 | 3 | 3 | 100.00 | 0 | 0.00 | |
| 辽宁 | 14 | 0 | 0.00 | 14 | 100.00 | 陕西 | 7 | 3 | 42.86 | 4 | 57.14 | |
| 吉林 | 6 | 0 | 0.00 | 6 | 100.00 | 甘肃 | 5 | 1 | 20.00 | 4 | 80.00 | |
| 黑龙江 | 12 | 0 | 0.00 | 12 | 100.00 | 青海 | 1 | 1 | 100.00 | 0 | 0.00 | |
| 山西 | 9 | 1 | 11.11 | 8 | 88.89 | 宁夏 | 1 | 1 | 100.00 | 0 | 0.00 | |
| 安徽 | 15 | 15 | 100.00 | 0 | 0.00 | 新疆 | 2 | 0 | 0.00 | 2 | 100.00 | |
表4 双向动态空间面板杜宾模型估计结果Tab.4 Results of bidirectional dynamic spatial panel Durbin model estimation |
| 变量 | (1) 反距离地理空间权重 矩阵 | (2) 地理与经济距离 嵌套矩阵 | (3) 未剔除共同因子 的估计结果 |
|---|---|---|---|
| Human | -0.0082***(0.0001) | -0.0007***(0.0001) | -0.0025***(0.0001) |
| Scale | 0.4461***(0.0226) | 0.0366(0.0228) | 1.7048***(0.0243) |
| Market | -1.3232***(0.0538) | -0.0981*(0.0539) | 2.3351***(0.0574) |
| Consum | 0.7827***(0.0311) | 0.1048***(0.0311) | -0.2663***(0.0332) |
| Bigdata | 4.0887***(0.0360) | 0.3231***(0.0372) | -0.4647***(0.0384) |
| Gov | 5.0823***(0.1467) | 0.8617***(0.1469) | 13.4147***(0.1570) |
| Finance | -0.7752***(0.0116) | -0.0647***(0.0116) | -0.9430***(0.0124) |
| Dinvt-1 | -2.2612***(0.0132) | 0.1400***(0.0132) | -0.2206***(0.0123) |
| WDinv | 191.0413***(0.0783) | 11.8747***(0.0721) | 75.8203***(0.0799) |
| WDinvt-1 | 145.0035***(0.1135) | 10.4977***(0.1012) | 9.3192***(0.1009) |
| WHuman | -0.5131***(0.0008) | -0.0260***(0.0007) | -0.1501***(0.0009) |
| WScale | -148.4452***(0.1472) | -8.1660***(0.1324) | -108.5872***(0.1789) |
| WMarket | -214.9572***(0.5551) | -7.7081***(0.4664) | 173.6384***(0.6134) |
| WConsum | 79.4964***(0.2107) | 4.7637***(0.1901) | -7.1796***(0.2241) |
| WBigdata | -58.9533***(0.1880) | -3.3740***(0.1780) | 2.7672***(0.1994) |
| WGov | -26.4579***(0.7343) | 2.2531***(0.6690) | 135.7371***(0.7954) |
| WFinance | -25.4618***(0.0912) | -1.2185***(0.0763) | -28.3195***(0.1000) |
| Log-likelihood | -1691.2813 | -1691.4013 | -2009.8441 |
注:表中***、**和*分别表示计量结果的显著性水平为1%、5%和10%,括号内的数值是标准误。表5同。 |
表5 双向动态空间面板杜宾模型的直接效应和间接效应Tab.5 Direct and indirect effects of bidirectional dynamic spatial panel Durbin model |
| 权重矩阵 | 效应 | Human | Scale | Market | Consum | Bigdata | Gov | Finance |
|---|---|---|---|---|---|---|---|---|
| 反距离地理 空间权重矩阵 | 短期直 接效应 | 0.0013*** (0.0000) | 0.7339*** (0.0035) | 0.8062*** (0.0111) | -0.2597*** (0.0057) | 0.8010*** (0.0128) | 0.7826*** (0.0249) | 0.0150*** (0.0032) |
| 短期间 接效应 | 0.0015*** (0.0000) | 0.0448*** (0.0032) | 0.3317*** (0.0103) | -0.1627*** (0.0056) | -0.5123*** (0.0127) | -0.6700*** (0.0247) | 0.1230*** (0.0031) | |
| 短期 总效应 | 0.0027*** (0.0000) | 0.7788*** (0.0007) | 1.1378*** (0.0030) | -0.4224*** (0.0010) | 0.2887*** (0.0009) | 0.1127*** (0.0036) | 0.1381*** (0.0005) | |
| 长期直 接效应 | 0.0010*** (0.0000) | 0.4032*** (0.0011) | 0.5075*** (0.0028) | -0.1763*** (0.0014) | 0.3117*** (0.0019) | 0.2658*** (0.0063) | 0.0362*** (0.0006) | |
| 长期间 接效应 | 0.0006*** (0.0000) | 0.0415*** (0.0009) | 0.1423*** (0.0022) | -0.0649*** (0.0013) | -0.1468*** (0.0016) | -0.2014*** (0.0060) | 0.0426*** (0.0005) | |
| 长期 总效应 | 0.0016*** (0.0000) | 0.4447*** (0.0004) | 0.6498*** (0.0017) | -0.2412*** (0.0006) | 0.1649*** (0.0005) | 0.0643*** (0.0021) | 0.0788*** (0.0003) | |
| 地理与经济 距离嵌套矩阵 | 短期直 接效应 | -0.0040 (0.0948) | -0.7122 (21.5886) | -0.7854 (23.2236) | 0.7591 (17.5053) | 0.3449 (0.9820) | 1.7410 (31.9364) | -0.2111 (5.1677) |
| 短期间 接效应 | 0.0064 (0.0948) | 1.4595 (21.5892) | 1.5003 (23.2202) | -1.2056 (17.5057) | -0.0647 (0.9807) | -2.0241 (31.9368) | 0.3291 (5.1674) | |
| 短期 总效应 | 0.0025*** (0.0001) | 0.7473*** (0.0116) | 0.7149*** (0.0444) | -0.4465*** (0.0160) | 0.2802*** (0.0140) | -0.2831*** (0.0581) | 0.1180*** (0.0068) | |
| 长期直 接效应 | 0.0005*** (0.0001) | 0.2629*** (0.0153) | 0.1986*** (0.0309) | -0.1059*** (0.0172) | 0.2221*** (0.0203) | 0.2498*** (0.0705) | 0.0137** (0.0067) | |
| 长期间 接效应 | 0.0007*** (0.0001) | 0.1150*** (0.0134) | 0.1629*** (0.0265) | -0.1199*** (0.0169) | -0.0805*** (0.0164) | -0.3930*** (0.0683) | 0.0460*** (0.0062) | |
| 长期 总效应 | 0.0012*** (0.0000) | 0.3779*** (0.0056) | 0.3615*** (0.0223) | -0.2258*** (0.0081) | 0.1417*** (0.0070) | -0.1432*** (0.0293) | 0.0597*** (0.0034) | |
| 未剔除共同因 子的估计结果 | 短期直 接效应 | 0.0076*** (0.0012) | 1.0904*** (0.0782) | -8.0883*** (1.2803) | 0.5459*** (0.1080) | 0.4996*** (0.1256) | -20.8381*** (4.1671) | 2.0219*** (0.3613) |
| 短期间 接效应 | -0.0055*** (0.0012) | 0.3380*** (0.0794) | 5.7362*** (1.2785) | -0.4462*** (0.1076) | -0.5304*** (0.1260) | 18.8454*** (4.1652) | -1.6308*** (0.3609) | |
| 短期 总效应 | 0.0020*** (0.0000) | 1.4284*** (0.0025) | -2.3521*** (0.0085) | 0.0997*** (0.0028) | -0.0308*** (0.0023) | -1.9927*** (0.0102) | 0.3911*** (0.0013) | |
| 长期直 接效应 | -0.0006** (0.0003) | 1.3518*** (0.0152) | 0.4478 (0.2732) | -0.1051*** (0.0266) | -0.2515*** (0.0321) | 6.3240*** (0.8732) | -0.3623*** (0.0764) | |
| 长期间 接效应 | 0.0024*** (0.0003) | -0.0783*** (0.0153) | -2.5449*** (0.2721) | 0.1940*** (0.0262) | 0.2240*** (0.0313) | -8.1006*** (0.8719) | 0.7109*** (0.0761) | |
| 长期 总效应 | 0.0018*** (0.0000) | 1.2735*** (0.0022) | -2.0971*** (0.0076) | 0.0889*** (0.0025) | -0.0275*** (0.0021) | -1.7767*** (0.0091) | 0.3487*** (0.0012) |
| [1] |
求是编辑部. 发展我国数字经济的科学指引[J]. 求是, 2022(2):9-14.
|
| [2] |
习近平. 不断做强做优做大我国数字经济[J]. 求是, 2022(2):4-8.
|
| [3] |
贺俊. 数字技术创新体系的特征与政府作用[J]. 求索, 2023(5):107-115.
|
| [4] |
|
| [5] |
田秀娟, 李睿. 数字技术赋能实体经济转型发展——基于熊彼特内生增长理论的分析框架[J]. 管理世界, 2022, 38(5):56-74.
|
| [6] |
黄勃, 李海彤, 刘俊岐, 等. 数字技术创新与中国企业高质量发展——来自企业数字专利的证据[J]. 经济研究, 2023, 58(3):97-115.
|
| [7] |
陶锋, 朱盼, 邱楚芝, 等. 数字技术创新对企业市场价值的影响研究[J]. 数量经济技术经济研究, 2023, 40(5):68-91.
|
| [8] |
|
| [9] |
张辽, 姚蕾. 数字技术创新对城市经济韧性的影响研究——来自中国278个地级及以上城市的经验证据[J]. 管理学刊, 2023, 36(5):38-59.
|
| [10] |
潘冬. 知识产权示范城市建设能促进企业数字创新吗?[J]. 经济体制改革, 2023(5):49-58.
|
| [11] |
赵扬, 杜凯. “加速折旧”如何赋能数字企业创新?[J]. 南方经济, 2023(4):130-158.
|
| [12] |
夏范社, 何德旭. 明星分析师第一名关注与企业数字技术创新[J]. 山西财经大学学报, 2023, 45(11):100-111.
|
| [13] |
唐蓓, 刘林荧. 数字并购能够提高企业的数字创新绩效吗?——基于A股上市公司的实证研究[J]. 东岳论丛, 2023, 44(10):142-153.
|
| [14] |
刘洋, 董久钰, 魏江. 数字创新管理:理论框架与未来研究[J]. 管理世界, 2020, 36(7):198-217,219.
|
| [15] |
周浩, 李健斌. 中国数字经济创新活动的特征事实与分析——来自专利的证据[J]. 暨南学报:哲学社会科学版, 2023, 45(9):54-68.
|
| [16] |
黄睿, 王坤, 黄震方, 等. 绩效视角下区域旅游发展格局的时空动态及耦合关系——以泛长江三角洲为例[J]. 地理研究, 2018, 37 (5):995-1008.
|
| [17] |
刘凤朝, 冯婷婷, 孙玉涛. 技术创新、FDI与经济重心移动及空间相关分析[J]. 大连理工大学学报:社会科学版, 2010, 31(3):1-7.
|
| [18] |
辛晓华, 吕拉昌. 中国城市创新重心的时空演变特征.[J] 地域研究与开发, 2020, 39(4):53-59.
|
| [19] |
白冰, 赵作权, 张佩. 中国南北区域经济空间融合发展的趋势与布局[J]. 经济地理, 2021, 41(2):1-10.
|
| [20] |
沈宏婷. 中国创新投入与创新产出的重心演变及耦合关系研究[J]. 现代经济探讨, 2023(4):125-132.
|
| [21] |
张萃, 王佰芳. 国内国际创新合作网络与城市创新[J]. 财贸经济, 2023, 44(11):122-136.
|
| [22] |
邹炀. 高等教育的多中心布局能提高城市创新水平吗[J]. 重庆高教研究, 2024, 12(1):46-62.
|
| [23] |
胡增玺, 马述忠. 市场一体化对企业数字创新的影响——兼论数字创新衡量方法[J]. 经济研究, 2023, 58(6):155-172.
|
| [24] |
|
| [25] |
谢康, 夏正豪, 肖静华. 大数据成为现实生产要素的企业实现机制:产品创新视角[J]. 中国工业经济, 2020(5):42-60.
|
| [26] |
韩峰, 阳立高. 生产性服务业集聚如何影响制造业结构升级?——一个集聚经济与熊彼特内生增长理论的综合框架[J]. 管理世界, 2020, 36(2):72-94,219.
|
| [27] |
|
| [28] |
|
| [29] |
孙勇, 樊杰, 刘汉初, 等. 长三角地区数字技术创新时空格局及其影响因素[J]. 经济地理, 2022, 42(2):124-133.
|
| [30] |
左万水, 古恒宇, 周麟, 等. 中国市域数字经济创新空间格局演化及其驱动机制[J]. 经济地理, 2024, 44(6):102-112.
|
| [31] |
樊杰, 赵浩, 郭锐. 我国区域发展差距变化的新趋势与应对策略[J]. 经济地理, 2022, 42(1):1-11.
|
| [32] |
周民良. 经济重心、区域差距与协调发展[J]. 中国社会科学, 2000(2):42-53,206.
|
| [33] |
邓峰, 王一飞. 技术锁定对创新绩效的影响:创新模式的调节作用[J]. 科技进步与对策, 2022, 39(14):1-11.
|
| [34] |
杨震宁, 李东红, 马振中. 关系资本,锁定效应与中国制造业企业创新[J]. 科研管理, 2013, 34(11):42-52.
|
/
| 〈 |
|
〉 |