
The Influence of Urban Multiple Supply on Population Cross-region Flow in China
Received date: 2024-01-26
Revised date: 2024-04-19
Online published: 2024-09-13
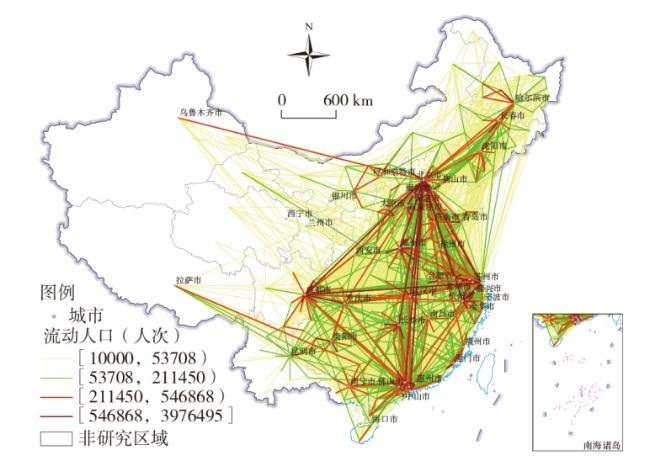
The supply imbalance between cities drives population movement to other cities to meet their needs. In the early stages of China's reform and opening-up,the primary supply-demand relationship between population and cities was centered on the population's demand for economic development and the supply of urban labor markets. Once individual labor income meets the production,investment,basic consumption,and basic security needs of individuals or families,the population's demands begin to diversify. Consequently,the supply capacities of cities in terms of consumption,entertainment,landscapes,and transportation start to exert push-pull forces on population flow. This paper leverages Tencent's location big data to construct a population cross-region flow network. It uses the QAP regression model to analyze various supply factors influencing population flow in the process of population movement,and explores the hierarchical and temporal heterogeneity of population flow. The study reveals the following findings: 1) Railway transportation,catering and entertainment,and economic supply are the main factors affecting inter-city population flow,with landscape supply showing sensitivity to time choices. 2) Mobile populations have different demands for cities at different levels,with financial elements showing a diminishing marginal effect by level. However,the supply of catering,entertainment,and railway transportation does not exhibit significant hierarchical heterogeneity. 3) Population flow shows temporal heterogeneity. During holidays,landscape supply shows a significantly positive effect on the population flow,while the significance level for economic supply noticeably decreases.
LI Zhuowei , WANG Shijun , ZHAO Ziyu , SHI Xiang , ZHAO Yuanfei . The Influence of Urban Multiple Supply on Population Cross-region Flow in China[J]. Economic geography, 2024 , 44(7) : 68 -77 . DOI: 10.15957/j.cnki.jjdl.2024.07.007
表1 中国城市多元供给解释变量Tab.1 Explanatory variables of multiple supply capacity in Chinese cities |
| 变量类型 | 变量名称 | 变量内容 | 数据来源 | 关系矩阵构建方法 |
|---|---|---|---|---|
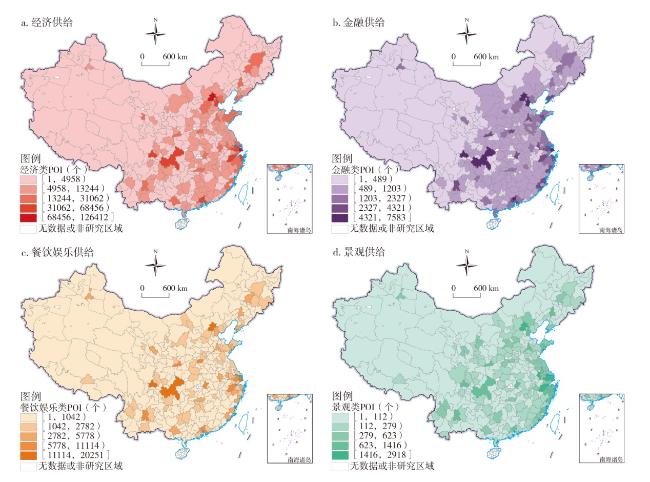
| 城市内部 供给要素 | 经济供给 | 公司类、企业类POI数量 | 高德POI数据(2019) | (2) 式中:m表示供给类型; 表示城市i与j之间m要素的联系强度 |
| 金融供给 | 银行类、金融型企业POI数量 | 高德POI数据(2019) | ||
| 餐饮娱乐供给 | 餐饮服务类和休闲娱乐类POI数量 | 四维图新POI数据(2019) | ||
| 景观供给 | 1A至5A级别的旅游型、景区型POI数量 | 四维图新POI数据(2019) | ||
| 城市间 供给要素 | 铁路交通供给 | OD城市间的日均高铁班次 | 中国铁路客户服务中心 | 参考公式(1)构建铁路交通网 |
| 航空交通供给 | OD城市间的日均航空班次 | 中国民用航空局 | 参考公式(1)构建航空网络 | |
| 其他变量 | 空间距离 | OD城市间的空间距离 | 自然资源部标准地图服务系统 | 在ArcGIS软件中,获取城市间的欧式距离(km) |
注:公式(2)参考重力模型。由于在其他变量中重点考量城市空间距离,故公式(2)中刨除对空间距离的探讨。 |
表2 人口流动与城市多元供给解释变量的QAP回归结果Tab.2 QAP regression results of population flow and the explanatory variables of urban multiple supply |
| 影响因素 | 标准化 回归系数 | 非标准化 回归系数 | 显著性水平P |
|---|---|---|---|
| 经济供给 | 0.822*** | 0.198*** | 0.005 |
| 餐饮娱乐供给 | 1.490*** | 1.975*** | ≤0.001 |
| 金融供给 | -1.151*** | -3.396*** | ≤0.001 |
| 景观供给 | -0.084 | -15.631 | 0.236 |
| 高铁交通供给 | 5.537*** | 1000.854*** | ≤0.001 |
| 航空交通供给 | -0.001 | -22.992 | 0.288 |
| 空间距离 | -0.072* | 0.001* | 0.097 |
| 回归截距 | 0.000 | -1173.993 | |
| Adj R2 | 0.344 |
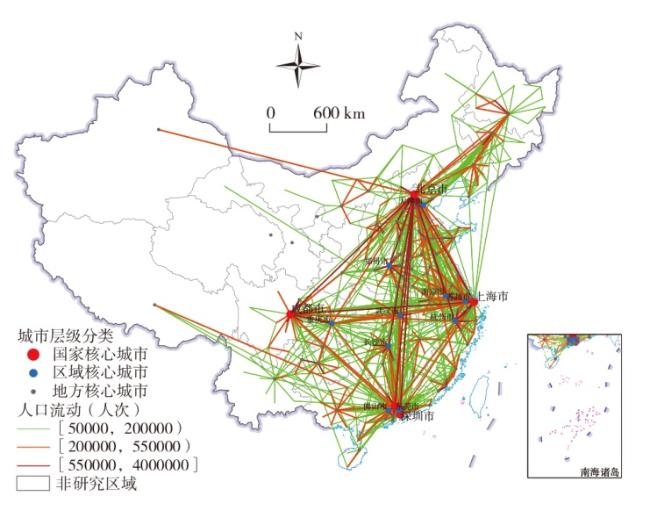
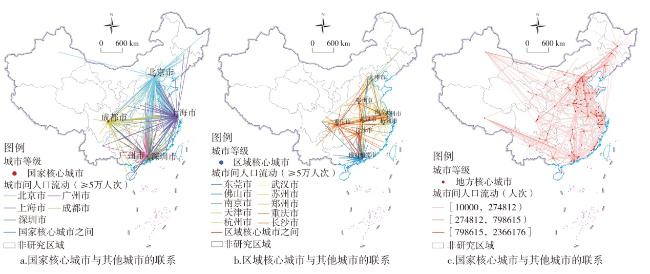
表3 不同层级城市人口流动与多元供给的OLS回归结果Tab.3 The OLS regression results of population flow and multiple supply in cities of different hierarchical levels |
| 城市层级 | 影响因素 | 标准化回归 系数Beta | t | 显著性 水平P | VIF |
|---|---|---|---|---|---|
| 国家核心 城市 | 经济供给 | -0.515*** | -13.837 | ≤0.001 | 6.971 |
| 餐饮娱乐供给 | 0.376*** | 11.740 | ≤0.001 | 5.169 | |
| 金融供给 | 0.457*** | 16.542 | ≤0.001 | 3.847 | |
| 景观供给 | -0.040 | -1.728 | 0.185 | 2.710 | |
| 高铁交通供给 | 0.483*** | 30.061 | ≤0.001 | 1.301 | |
| 航空交通供给 | -0.088*** | -4.696 | ≤0.001 | 1.201 | |
| 空间距离 | -0.077*** | -5.035 | ≤0.001 | 1.179 | |
| Adj R2 | 0.478 | ||||
| 区域核心 城市 | 经济供给 | 0.048*** | 2.413 | 0.001 | 3.837 |
| 餐饮娱乐供给 | 0.097*** | 4.031 | ≤0.001 | 5.634 | |
| 金融供给 | 0.126** | 4.652 | 0.021 | 7.041 | |
| 景观供给 | -0.187*** | -10.522 | ≤0.001 | 3.046 | |
| 高铁交通供给 | 0.667*** | 59.152 | ≤0.001 | 1.226 | |
| 航空交通供给 | -0.008 | -0.737 | 0.461 | 1.087 | |
| 城市空间距离 | -0.017** | -1.544 | 0.013 | 1.152 | |
| Adj R2 | 0.529 | ||||
| 地方核心 城市 | 经济供给 | 0.114*** | 6.958 | 0.001 | 7.603 |
| 餐饮娱乐供给 | 0.131*** | 8.170 | ≤0.001 | 7.395 | |
| 金融供给 | -0.161*** | -9.543 | ≤0.001 | 8.143 | |
| 景观供给 | 0.048*** | 5.121 | ≤0.001 | 2.532 | |
| 高铁交通供给 | 0.518*** | 79.984 | ≤0.001 | 1.195 | |
| 航空交通供给 | -0.035*** | -5.403 | ≤0.001 | 1.177 | |
| 城市空间距离 | -0.124*** | -19.253 | ≤0.001 | 1.190 | |
| Adj R2 | 0.364 |
表4 不同时期人口流动与城市多元供给的QAP回归结果Tab.4 QAP regression results of population flow and urban multiple supply in different periods |
| 影响因素 | 假期 | 周末 | 工作日 | ||||||
|---|---|---|---|---|---|---|---|---|---|
| 标准化回归系数 | 非标准化回归系数 | 显著性 水平P | 标准化回归系数 | 非标准化回归系数 | 显著性 水平P | 标准化回归系数 | 非标准化回归系数 | 显著性 水平P | |
| 经济供给 | 2.745* | 0.017 | 0.099 | 5.982*** | 0.059 | 0.007 | 7.604*** | 0.153 | 0.002 |
| 餐饮娱乐供给 | 10.271*** | 0.359 | ≤0.001 | 11.092*** | 0.600 | ≤0.001 | 11.288*** | 1.247 | ≤0.001 |
| 金融供给 | -5.657*** | -0.440 | 0.005 | -8.320*** | -1.002 | ≤0.001 | -9.627*** | -2.368 | ≤0.001 |
| 景观供给 | 3.188*** | 15.704 | 0.002 | -1.938** | -14.776 | 0.033 | -1.438* | -22.400 | 0.090 |
| 铁路交通供给 | 55.992*** | 266.777 | ≤0.001 | 54.122*** | 399.208 | ≤0.001 | 52.752*** | 794.694 | ≤0.001 |
| 航空交通供给 | -2.043*** | -56.781 | ≤0.001 | -0.731** | -31.439 | 0.025 | 0.008 | 0.687 | 0.467 |
| 空间距离 | 0.172 | 0.000 | 0.369 | 0.326 | 0.000 | 0.268 | 0.093 | 0.000 | 0.420 |
| 回归截距 | 0.000 | -198.305 | 0.000 | -585.563 | 0.000 | -1132.848 | |||
| Adj R2 | 0.324 | 0.312 | 0.301 | ||||||
| [1] |
朱宇, 林李月. 中国人口迁移流动的时间过程及其空间效应研究:回顾与展望[J]. 地理科学, 2016, 36(6):820-828.
|
| [2] |
|
| [3] |
顾朝林, 蔡建明, 张伟, 等. 中国大中城市流动人口迁移规律研究[J]. 地理学报, 1999, 54(3):14-22.
|
| [4] |
施响, 王士君, 王冬艳, 等. 中国市域间日常人口流动特征及影响因素[J]. 地理科学, 2022, 42(11):1889-1899.
|
| [5] |
陆铭. 城市、区域和国家发展——空间政治经济学的现在与未来[J]. 经济学(季刊), 2017, 16(4):1499-1532.
|
| [6] |
赵梓渝, 魏冶, 杨冉, 等. 中国人口省际流动重力模型的参数标定与误差估算[J]. 地理学报, 2019, 74(2):203-221.
|
| [7] |
潘竟虎, 魏石梅, 张蓉, 等. 中国居民城际出行网络的空间结构特征[J]. 地理学报, 2022, 77(10):2494-2513.
|
| [8] |
|
| [9] |
|
| [10] |
潘碧麟, 王江浩, 葛咏, 等. 基于微博签到数据的成渝城市群空间结构及其城际人口流动研究[J]. 地球信息科学学报, 2019, 21(1):68-76.
|
| [11] |
浩飞龙, 吴潇然, 关皓明, 等. 基于百度迁徙数据的东北地区城市“层级—网络”结构[J]. 地理科学, 2023, 43(2):251-261.
|
| [12] |
李卓伟, 王士君, 程利莎, 等. 东北地区人口流动与多元交通网络格局的偏离和关联[J]. 地理科学进展, 2022, 41(6):985-998.
|
| [13] |
|
| [14] |
|
| [15] |
|
| [16] |
|
| [17] |
|
| [18] |
|
| [19] |
|
| [20] |
|
| [21] |
|
| [22] |
|
| [23] |
丁亮, 钮心毅, 宋小冬. 上海中心城就业中心体系测度——基于手机信令数据的研究[J]. 地理学报, 2016, 71(3):484-499.
|
| [24] |
|
| [25] |
陈艳如, 谷跃, 宋伟轩, 等. 长三角流动人口居留意愿差异及其影响因素[J]. 经济地理, 2022, 42(9):59-67.
|
| [26] |
浩飞龙, 张杰, 王士君. 国内外城市舒适性研究综述与展望[J]. 地理科学进展, 2022, 41(12):2396-2409.
|
| [27] |
亚当·斯密. 国富论:国民财富的性质和起因的研究[M]. 长沙: 中南大学出版社, 2003.
|
| [28] |
|
| [29] |
张华, 刘哲达, 殷小冰. 中国跨省流动人口回流意愿的空间差异及影响因素[J]. 地理科学进展, 2021, 40(1):73-84.
|
| [30] |
张伟丽, 郝智娟, 王伊斌, 等. 城市群人口流动空间网络及影响因素[J]. 地理科学, 2023, 43(1):72-81.
|
| [31] |
李涛, 刘家明, 朱鹤, 等. 中国旅游产业投资及旅游发展空间结构响应——基于2000-2015年旅游业三大核心部门数据的分析[J]. 地理科学, 2019, 39(2):204-213.
|
| [32] |
|
| [33] |
薛冰, 肖骁, 李京忠, 等. 基于POI大数据的城市零售业空间热点分析——以辽宁省沈阳市为例[J]. 经济地理, 2018, 38(5):36-43.
|
| [34] |
马学广, 鹿宇. 基于航空客运流的中国城市空间格局与空间联系[J]. 经济地理, 2018, 38(8):47-57.
|
| [35] |
刘军. QAP:测量“关系”之间关系的一种方法[J]. 社会, 2007(4):164-174,209.
|
| [36] |
|
| [37] |
中华人民共和国交通运输部. 2019年交通运输行业发展统计公报[R/OL]. https://xxgk.mot.gov.cn/2020/jigou/zhghs/202006/t20200630_3321335.html,2020-06-30. 2020-06-30.
|
| [38] |
方创琳. 新发展格局下的中国城市群与都市圈建设[J]. 经济地理, 2021, 41(4):1-7.
|
| [39] |
刘张, 千家乐, 杜云艳, 等. 基于多源时空大数据的区际迁徙人群多层次空间分布估算模型——以COVID-19疫情期间自武汉迁出人群为例[J]. 地球信息科学学报, 2020, 22(2):147-160.
|
/
| 〈 |
|
〉 |