
Measurement and Spatiotemporal Evolution of Common Prosperity Level in China at the Provincial Level
Received date: 2023-09-13
Revised date: 2024-02-10
Online published: 2024-09-13
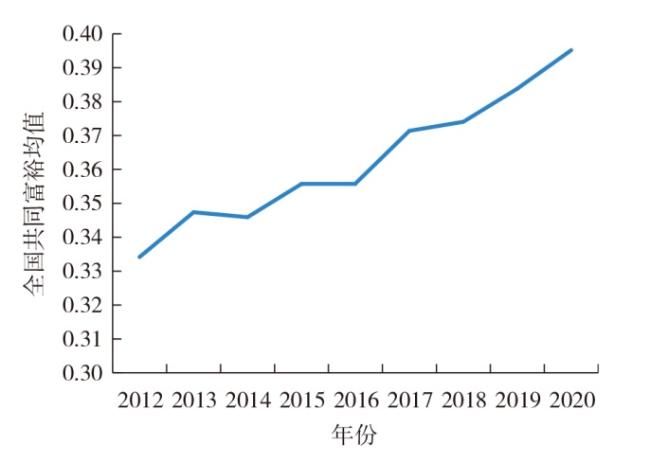
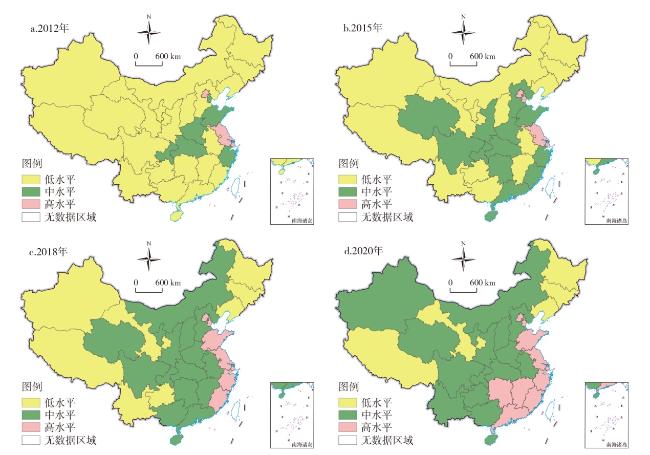
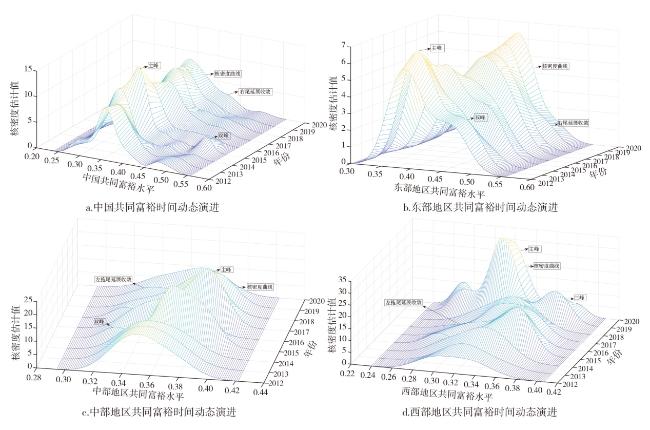
Common prosperity is the essential requirement of socialism and an important feature of Chinese-style modernization. According to the connotation,direction and path of common prosperity,this paper takes 31 provincial-level regions of China from 2012 to 2020 as the research object,and constructs the evaluation index system of common prosperity level. It uses the entropy method to measure the process of common prosperity in 31 provincial-level regions of China. The results show that: 1) From 2012 to 2020,China's common prosperity has shown phased development,the trend of the common prosperity process is positive in China. 2) From the perspective of spatial evolution,the number of provincial-level regions with low-level- common prosperity decreases significantly over time,the number of provincial-level regions with medium-level common prosperity increases the fastest,and the number of provincial-level regions with high-level common prosperity increases significantly. 3) From the perspective of evolution direction,the development direction of the provincial-level regions with medium-level common prosperity develops from the southeast of China to the northwest of China,and the provincial-level regions with high-level common prosperity first expand to the south of China from the eastern coastal provinces,and gradually extend to the northwest of China in 2020. 4) From the perspective of the regional disparities,the dispersion degree of common prosperity has an expanding trend in the whole country,the central region and the western region,while it has a significantly decreasing trend in eastern region. In addition to the intensified polarization in the western region,the polarization phenomenon in other regions has significantly eased. From the perspective of long-term evolution trend,all provincial-level regions in China will shift to a high-level common prosperity.
WU Changnan , CHEN Yuying . Measurement and Spatiotemporal Evolution of Common Prosperity Level in China at the Provincial Level[J]. Economic geography, 2024 , 44(7) : 13 -21 . DOI: 10.15957/j.cnki.jjdl.2024.07.002
表1 区域共同富裕水平评价指标体系Tab.1 Evaluation index system of regional common prosperity level |
| 一级指标及其权重 | 二级指标及其权重 | 三级指标及其权重 | 方向 |
|---|---|---|---|
| 经济高质量发展 (6.0621) | (1)发展水平(3.0369) | GDP年增长率(3.0369) | + |
| (2)发展质量(3.0252) | 全要素生产率(3.0252) | + | |
| 创新创业 (11.4313) | (3)创业活跃度(5.984) | 每万人企业数(2.9445) | + |
| 每万人新增企业数(3.0395) | + | ||
| (4)创新能力(5.4473) | 每万人高新技术企业数(2.7055) | + | |
| 每万人授权发明专利数(2.7418) | + | ||
| 发展平衡性、协调性、包容性 (11.8913) | (5)地区收入差距(3.0225) | 泰尔指数(3.0225) | - |
| (6)城乡收入差距(3.0302) | (t年城乡收入差距)-(t-1)年城乡收入差距(3.0302) | - | |
| (7)行业发展差距(2.9160) | 各地区全国500强企业数/地区总企业数(2.9160) | + | |
| (8)地区发展差距(2.9225) | 地区人均GDP/全国人均GDP(2.9225) | + | |
| 中等收入群体规模 (2.9364) | (9)中等收入群体规模(2.9364) | 地区律师、公务员、全科医生、注册会计师、高校教师、私营企业主、上市公司高管与金融业从业人员数量之和(2.9364) | + |
| 基本公共服务均等化 (32.4021) | (10)教育水平(9.0268) | 每十万人口学前教育在校生数(2.9935) | + |
| 平均教育年限(3.0317) | + | ||
| 大学以上学历人口占比(3.0016) | + | ||
| (11)养老保障(2.8183) | 公立养老机构人数(2.8183) | + | |
| (12)住房保障(2.9884) | 人均按用途分的房地产开发企业商品房竣工面积(2.9884) | + | |
| (13)卫生保障(3.0151) | 每万人医院床位数(3.0151) | + | |
| 每万人全科医生数(2.9638) | + | ||
| (14)最低生活保障(2.9538) | 城乡平均最低生活保障水平(2.9538) | + | |
| (15)环境质量(3.0257) | 中国绿色发展指数(3.0257) | + | |
| (16)社会捐赠(2.6955) | 人均社会捐赠金额(2.6955) | + | |
| (17)公共文化(2.9148) | 人均文化和旅游事业费(2.9148) | + | |
| 农民农村共同富裕 (23.2270) | (18)农民收入水平(2.9767) | 农民人均可支配收入/全国人均可支配收入(2.9767) | + |
| (19)农业经济(3.0105) | 镇区及乡村消费品零售额/全社会消费品零售额(3.0105) | + | |
| (20)农业生产条件(3.0052) | 农业机耕面积占比(3.0052) | + | |
| (21)农村基础设施(14.2345) | 供水普及率(3.0042) | + | |
| 燃气普及率(2.8644) | + | ||
| 村庄内道路面积(2.9154) | + | ||
| 排水管道沟渠长度(2.8209) | + | ||
| 人均水电投资额(2.6296) | + | ||
| 社会治理 (12.0499) | (22)生产生活安全(6.0589) | 生产安全事故发生率(3.0315) | - |
| 年交通事故发生率(3.0274) | - | ||
| (23)社会信用水平(5.9910) | 万人犯罪率(2.9547) | - | |
| 失信企业与地区企业总数的比值(3.0363) | - |
表2 2012—2020年省域共同富裕水平Tab.2 Common prosperity level at the provincial level from 2012 to 2020 |
| 省域 | 2012 | 2013 | 2014 | 2015 | 2016 | 2017 | 2018 | 2019 | 2020 | 均值 |
|---|---|---|---|---|---|---|---|---|---|---|
| 北京 | 0.4975 | 0.4993 | 0.5240 | 0.4935 | 0.5139 | 0.4956 | 0.5134 | 0.5561 | 0.5552 | 0.5165 |
| 天津 | 0.3998 | 0.4117 | 0.4158 | 0.4348 | 0.4537 | 0.4343 | 0.4225 | 0.3761 | 0.4333 | 0.4202 |
| 河北 | 0.3397 | 0.3487 | 0.3583 | 0.3654 | 0.3454 | 0.3741 | 0.3781 | 0.4029 | 0.3987 | 0.3679 |
| 山西 | 0.3218 | 0.3084 | 0.3074 | 0.3325 | 0.3437 | 0.3551 | 0.3480 | 0.3464 | 0.3630 | 0.3363 |
| 内蒙古 | 0.3162 | 0.3254 | 0.3103 | 0.3419 | 0.3512 | 0.3318 | 0.3695 | 0.3494 | 0.3673 | 0.3403 |
| 辽宁 | 0.3224 | 0.3438 | 0.3329 | 0.3329 | 0.3041 | 0.3327 | 0.3343 | 0.3215 | 0.3396 | 0.3294 |
| 吉林 | 0.3002 | 0.3151 | 0.3027 | 0.3264 | 0.3110 | 0.3044 | 0.3321 | 0.3182 | 0.3268 | 0.3152 |
| 黑龙江 | 0.3060 | 0.3073 | 0.3241 | 0.2943 | 0.3063 | 0.3355 | 0.3074 | 0.2982 | 0.3411 | 0.3133 |
| 上海 | 0.4661 | 0.4798 | 0.4610 | 0.4881 | 0.4581 | 0.4956 | 0.4850 | 0.5055 | 0.4854 | 0.4805 |
| 江苏 | 0.4615 | 0.4518 | 0.4554 | 0.4899 | 0.4965 | 0.4741 | 0.4741 | 0.4683 | 0.4793 | 0.4723 |
| 浙江 | 0.3869 | 0.3893 | 0.4026 | 0.3999 | 0.4212 | 0.4364 | 0.4391 | 0.4551 | 0.4606 | 0.4212 |
| 安徽 | 0.3284 | 0.3359 | 0.3096 | 0.3257 | 0.3458 | 0.3708 | 0.3833 | 0.3982 | 0.4025 | 0.3556 |
| 福建 | 0.3311 | 0.3578 | 0.3350 | 0.3694 | 0.3677 | 0.4101 | 0.4105 | 0.4216 | 0.4148 | 0.3798 |
| 江西 | 0.3283 | 0.3580 | 0.3549 | 0.3341 | 0.3174 | 0.3502 | 0.3621 | 0.3803 | 0.4122 | 0.3553 |
| 山东 | 0.3705 | 0.3832 | 0.3708 | 0.3968 | 0.4035 | 0.4197 | 0.4444 | 0.4503 | 0.4646 | 0.4115 |
| 河南 | 0.3493 | 0.3371 | 0.3574 | 0.3444 | 0.3405 | 0.3677 | 0.3613 | 0.3777 | 0.3890 | 0.3583 |
| 湖北 | 0.3564 | 0.3528 | 0.3476 | 0.3522 | 0.3715 | 0.3667 | 0.3742 | 0.3914 | 0.3849 | 0.3664 |
| 湖南 | 0.3113 | 0.3234 | 0.3263 | 0.3555 | 0.3523 | 0.3759 | 0.3786 | 0.3973 | 0.4219 | 0.3603 |
| 广东 | 0.3304 | 0.3521 | 0.3381 | 0.3442 | 0.3724 | 0.3972 | 0.3858 | 0.4348 | 0.4436 | 0.3776 |
| 广西 | 0.3186 | 0.3357 | 0.3105 | 0.3217 | 0.3258 | 0.3518 | 0.3431 | 0.3318 | 0.3584 | 0.3330 |
| 海南 | 0.3274 | 0.3308 | 0.3462 | 0.3543 | 0.3541 | 0.3664 | 0.3730 | 0.3703 | 0.3697 | 0.3547 |
| 重庆 | 0.3630 | 0.3696 | 0.3292 | 0.3434 | 0.3433 | 0.3673 | 0.3786 | 0.3808 | 0.4068 | 0.3647 |
| 四川 | 0.3389 | 0.3762 | 0.3451 | 0.3436 | 0.3351 | 0.3662 | 0.3533 | 0.3758 | 0.3910 | 0.3584 |
| 贵州 | 0.2433 | 0.2867 | 0.2865 | 0.3137 | 0.3006 | 0.3248 | 0.3164 | 0.3442 | 0.3556 | 0.3080 |
| 云南 | 0.2638 | 0.2889 | 0.2720 | 0.2801 | 0.2698 | 0.3214 | 0.3148 | 0.3516 | 0.3593 | 0.3024 |
| 西藏 | 0.2398 | 0.2492 | 0.3147 | 0.3154 | 0.2875 | 0.2835 | 0.2924 | 0.3452 | 0.3299 | 0.2953 |
| 陕西 | 0.3089 | 0.3309 | 0.3329 | 0.3448 | 0.3451 | 0.3532 | 0.3614 | 0.3699 | 0.3747 | 0.3469 |
| 甘肃 | 0.2523 | 0.2923 | 0.2817 | 0.2716 | 0.2993 | 0.3133 | 0.3228 | 0.3261 | 0.3273 | 0.2985 |
| 青海 | 0.2760 | 0.3179 | 0.3296 | 0.3491 | 0.3337 | 0.3392 | 0.3474 | 0.3511 | 0.3692 | 0.3348 |
| 宁夏 | 0.2752 | 0.2913 | 0.3052 | 0.3401 | 0.3415 | 0.3629 | 0.3477 | 0.3472 | 0.3612 | 0.3303 |
| 新疆 | 0.3286 | 0.3177 | 0.3360 | 0.3285 | 0.3195 | 0.3347 | 0.3413 | 0.3560 | 0.3630 | 0.3361 |
表3 2012—2020年中国共同富裕类型传统与空间马尔科夫转移概率矩阵Tab.3 Traditional and spatial Markov transfer probability matrix of common prosperity types in China from 2012 to 2020 |
| 邻域类型 | n | t/t+1 | 1 | 2 | 3 |
|---|---|---|---|---|---|
| 传统马尔科夫概率矩阵 | 89 | 1 | 0.6854 | 0.3146 | 0.0000 |
| 82 | 2 | 0.1220 | 0.6951 | 0.1829 | |
| 77 | 3 | 0.0130 | 0.0260 | 0.9610 | |
| 1 | 58 | 1 | 0.7586 | 0.2414 | 0.0000 |
| 23 | 2 | 0.2174 | 0.6522 | 0.1304 | |
| 1 | 3 | 0.0000 | 1.0000 | 0.0000 | |
| 2 | 26 | 1 | 0.6154 | 0.3846 | 0.0000 |
| 45 | 2 | 0.0889 | 0.7778 | 0.1333 | |
| 9 | 3 | 0.1111 | 0.1111 | 0.7778 | |
| 3 | 5 | 1 | 0.2000 | 0.8000 | 0.0000 |
| 14 | 2 | 0.0714 | 0.5000 | 0.4286 | |
| 67 | 3 | 0.0000 | 0.0000 | 1.0000 |
注: 为省域数量,t表示某一时期,1、2、3分别表示按照三分位数将各地区共同富裕水平平均分成的3种类型。其中,1表示从小到大排列位于第一顺位内的类型,2表示从小到大排列位于第二顺位内的类型,3表示从小到大排列位于第三顺位内的类型。表4同。 |
表4 2012—2020年中国共同富裕类型的演进趋势预测Tab.4 Evolution trend of China's common prosperity type from 2012 to 2020 |
| 1 | 2 | 3 | ||
|---|---|---|---|---|
| 初始状态 | 0.6452 | 0.1613 | 0.1935 | |
| 终极状态 | 1 | 0.4434 | 0.4924 | 0.0642 |
| 2 | 0.2018 | 0.4989 | 0.2993 | |
| 3 | 0.0000 | 0.0000 | 1.0000 |
| [1] |
习近平. 扎实推动共同富裕[J]. 求是, 2021(20):4-8.
|
| [2] |
刘培林, 钱滔, 黄先海, 等. 共同富裕的内涵、实现路径与测度方法[J]. 管理世界, 2021, 37(8):117-129.
|
| [3] |
刘尚希. 论促进共同富裕的社会体制基础[J]. 行政管理改革, 2021(12):4-8.
|
| [4] |
李实. 共同富裕的目标和实现路径选择[J]. 经济研究, 2021, 56(11):4-13.
|
| [5] |
吕光明, 陈欣悦. 2035年共同富裕阶段目标实现指数监测研究[J]. 统计研究, 2022, 39(4):3-20.
|
| [6] |
彭刚, 杨德林, 杨琳. 中国市域尺度共同富裕水平格局及其影响因素[J]. 经济地理, 2023, 43(1):44-54,132.
|
| [7] |
何昀, 王帅尧, 谢迟. 中国省域共同富裕水平测度、时空分异与障碍因素[J]. 经济地理, 2024, 44(4):12-21.
|
| [8] |
覃成林, 杨霞. 先富地区带动了其他地区共同富裕吗——基于空间外溢效应的分析[J]. 中国工业经济, 2017(10):44-61.
|
| [9] |
万广华, 江葳蕤, 赵梦雪. 城镇化的共同富裕效应[J]. 中国农村经济, 2022(4):2-22.
|
| [10] |
金殿臣, 刘帅, 陈昕. 数字经济与共同富裕——基于276个地级市的实证检验[J]. 新疆师范大学学报:哲学社会科学版, 2023, 44(3):127-136.
|
| [11] |
彭刚, 杨德林, 杨琳. 中国市域尺度共同富裕水平格局及其影响因素[J]. 经济地理, 2023, 43(1):44-54,132.
|
| [12] |
张磊, 黄世玉, 刘长庚. 中国共同富裕的理论逻辑、事实格局及突破路径[J]. 经济学家, 2023(9):14-25.
|
| [13] |
邹伟勇, 许玲丽. 中国共同富裕的测度、区域差异及动态演化[J]. 地理科学, 2024, 44(1):71-81.
|
| [14] |
冯苑, 聂长飞. 中国共同富裕的时空演进、区域差异及收敛性研究[J]. 经济与管理研究, 2022, 43(12):65-84.
|
| [15] |
王军, 朱杰, 罗茜. 中国共同富裕发展水平测度及时空演变特征研究[J]. 当代经济管理, 2023, 45(6):51-60.
|
| [16] |
万海远, 陈基平. 共同富裕的理论内涵与量化方法[J]. 财贸经济, 2021, 42(12):18-33.
|
| [17] |
仲崇阳, 马新啸, 郑国坚. 中国省域共同富裕水平的地区差异及驱动效应[J]. 经济地理, 2023, 43(8):12-20,61.
|
| [18] |
赵满华. 共享发展的科学内涵及实现机制研究[J]. 经济问题, 2016(3):7-13,66.
|
| [19] |
曹亚雄, 刘雨萌. 新时代视域下的共同富裕及其实现路径[J]. 理论学刊, 2019(4):14-21.
|
| [20] |
甘煦, 田鹏, 林怡彤. 财富差距、家庭消费与共同富裕[J/OL]. 消费经济, 2024.1-14.
|
| [21] |
郑济洲, 崔翼. 财政分权、公共服务均等化与共同富裕[J]. 华东经济管理, 2024, 38(6):119-128.
|
| [22] |
谢加书, 王宇星. 数字经济赋能农民共同富裕——运作逻辑、堵点难点与增效路径[J]. 技术经济与管理研究, 2024(6):57-62.
|
| [23] |
吴昌南, 陈钰颖. 数字经济、创业与中等收入群体规模[J]. 改革, 2024(1):94-110.
|
| [24] |
陈冬仿. 共同富裕视域下发展壮大我国农村集体经济的理论依据与策略[J]. 江汉论坛, 2024(6):21-26.
|
| [25] |
张俊民, 石威峰, 傅绍正. 国家审计能缩小企业内部收入差距吗——基于共同富裕的视角[J]. 当代财经, 2024(1):140-151.
|
| [26] |
李慎明. 正确认识中国特色社会主义新时代社会主要矛盾[J]. 红旗文稿, 2018(5):7-12.
|
| [27] |
罗志恒, 杨新, 万赫. 共同富裕的现实内涵与实现路径:基于财税改革的视角[J]. 广东财经大学学报, 2022(1):4-13.
|
| [28] |
程恩富, 刘伟. 社会主义共同富裕的理论解读与实践剖析[J]. 马克思主义研究, 2012(6):41-47,159.
|
| [29] |
姜晓萍. 基本公共服务均等化是实现共同富裕的着力点[N]. 光明日报,2021-10-07(2).
|
| [30] |
习近平. 在深圳经济特区建立40周年庆祝大会上的讲话[EB/OL]. 中国政府网, https://www.gov.cn/xinwen/2020-10/14/content_5551299.htm.
|
| [31] |
徐向梅. 扎实推进农民农村共同富裕[N]. 经济日报,2022-06-08(11).
|
| [32] |
王军, 朱杰, 罗茜. 中国数字经济发展水平及演变测度[J]. 数量经济技术经济研究, 2021(7):26-42.
|
| [33] |
|
| [34] |
王少剑, 高爽, 黄永源. 基于超效率SBM模型的中国城市碳排放绩效时空演变格局及预测[J]. 地理学报, 2020(6):1316-1330.
|
/
| 〈 |
|
〉 |