
Spatial Cluster Identification and Spatial Entropy Decomposition of Furniture Industry Chain in the Pearl River Delta Region
Received date: 2023-12-14
Revised date: 2024-04-16
Online published: 2024-09-12
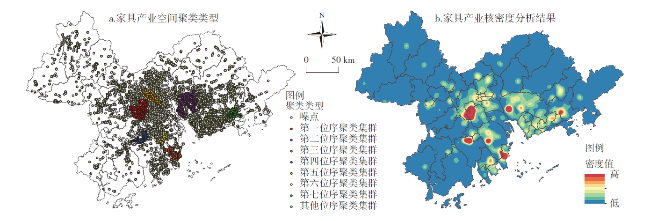
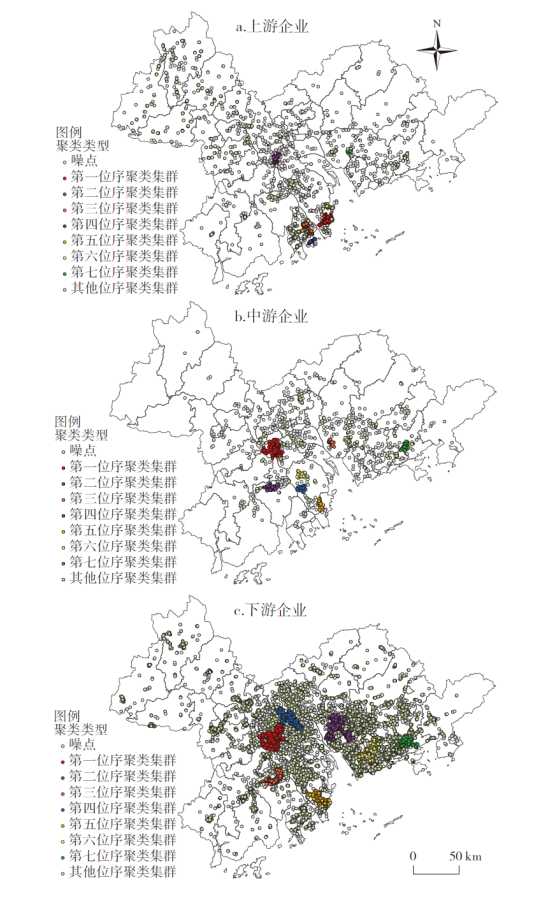
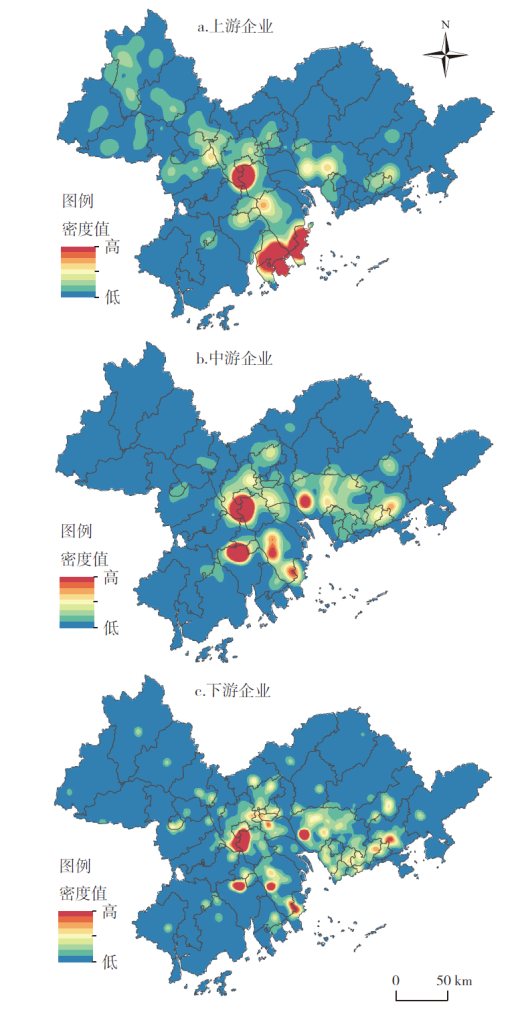
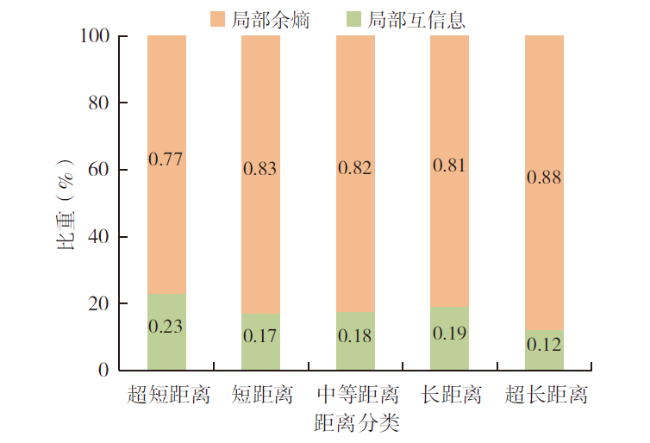
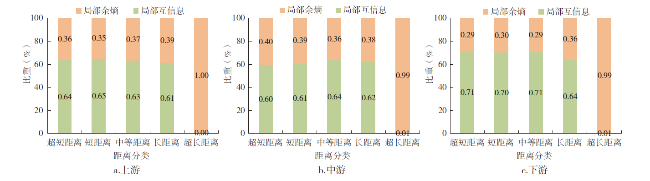
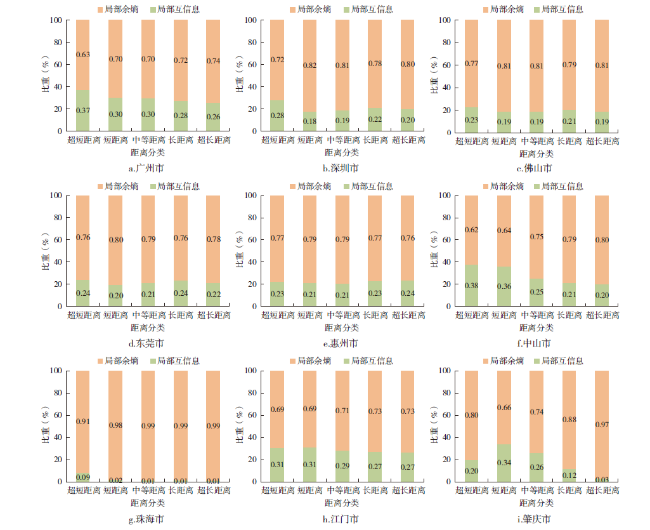
Based on the POI data of furniture enterprises in the whole industrial chain in the Pearl River Delta(PRD) region,this paper uses the spatial clustering algorithm of DBSCAN to identify and extract the spatial clustering clusters in the furniture industry,analyzes the overall characteristics,industrial chain structure characteristics,and hierarchical structure characteristics of spatial clustering in the furniture industry by the means of the kernel density estimation and the silhouette coefficient,and explores the driving forces of spatial clustering of furniture industry in the PRD region through the decomposition of spatial quotient index. The results show that: 1) There are 7 main clusters of furniture industry in the PRD region,which shows the "multi-core and fan-shaped" spatial distribution and the hierarchical structure characteristics of "one main center and three sub-centers",with the main center located in Shunde and the sub-centers located in Houjie,Shaxi and Xiangzhou. 2) The upstream enterprises of the furniture industry chain show the spatial clustering distribution characteristics of "two main centers and one sub-center",taking Shunde and Xiangzhou as the main centers and Doumen as the sub-center. The midstream and downstream enterprises show the spatial clustering distribution characteristics of "one main center and one sub-center",taking Shunde as the main center and Chancheng and Houjie as the sub-centers. 3) Non-spatial factors better explain the spatial clustering of the overall furniture industry in the PRD region,with the degree of explanation reaching 80%,and gradually increasing with the rise of spatial distance. On the contrary,spatial factors dominate the spatial clustering of the upper,middle and lower reaches of the furniture industry chain,with an explanation degree of about 60% to 70%. 4) The formation and evolution of spatial clustering of the furniture industry in each region of the PRD is influenced by spatial and non-spatial factors to varying degrees,spatial factors influencing the spatial clustering of the furniture industry in Guangzhou,Zhongshan and Jiangmen more prominently than that in other regions.
CHEN Zigui , SU Leyan , WU Kexing , WANG Zhenjun , DAI Xiangdong . Spatial Cluster Identification and Spatial Entropy Decomposition of Furniture Industry Chain in the Pearl River Delta Region[J]. Economic geography, 2024 , 44(4) : 131 -141 . DOI: 10.15957/j.cnki.jjdl.2024.04.014
表1 家具企业POI点分布情况Tab.1 Distribution of POI of furniture enterprises |
| 地区 | 总样本(个) | 上游样本(个) | 中游样本(个) | 下游样本(个) |
|---|---|---|---|---|
| 珠三角 | 24420 | 2827 | 1511 | 20082 |
| 广州 | 2729 | 87 | 149 | 2493 |
| 深圳 | 2028 | 66 | 74 | 1888 |
| 佛山 | 7561 | 511 | 507 | 6543 |
| 东莞 | 2903 | 167 | 199 | 2537 |
| 惠州 | 2060 | 85 | 117 | 1858 |
| 中山 | 1722 | 145 | 157 | 1420 |
| 珠海 | 1811 | 1066 | 22 | 723 |
| 江门 | 1873 | 130 | 243 | 1500 |
| 肇庆 | 1733 | 570 | 43 | 1120 |
表2 家具产业链空间聚类的等级结构和集群数量Tab.2 The hierarchical structure and number of spatial clustering of furniture industry chain |
| 总体样本 | 上游样本 | 中游样本 | 下游样本 | |||||||
|---|---|---|---|---|---|---|---|---|---|---|
| 等级 | 集群数量(个) | 等级 | 集群数量(个) | 等级 | 集群数量(个) | 等级 | 集群数量(个) | |||
| 1 | 1 | 1 | 2 | 1 | 1 | 1 | 1 | |||
| 2 | 3 | 2 | 1 | 2 | 1 | 2 | 1 | |||
| 3 | 346 | 3 | 91 | 3 | 38 | 3 | 307 | |||
表3 位序前10的家具产业链集群地点、等级及POI规模Tab.3 Top 10 furniture industry clusters in terms of location,level,and POI scale |
| 位序 | 位序前10的总体样本 | 位序前10的上游样本 | 位序前10的中游样本 | 位序前10的下游样本 | |||||||||||
|---|---|---|---|---|---|---|---|---|---|---|---|---|---|---|---|
| 集群地点 | 集群等级 | POI规模 | 集群地点 | 集群等级 | POI规模 | 集群地点 | 集群等级 | POI规模 | 集群地点 | 集群等级 | POI规模 | ||||
| 1 | 顺德区 | 第一 | 6092 | 顺德区 | 第一 | 350 | 顺德区 | 第一 | 381 | 顺德区 | 第一 | 5268 | |||
| 2 | 厚街镇 | 第二 | 1984 | 香洲区 | 第一 | 319 | 禅城区 | 第二 | 176 | 厚街镇 | 第二 | 1287 | |||
| 3 | 沙溪镇 | 第二 | 1165 | 斗门区 | 第二 | 187 | 厚街镇 | 第三 | 50 | 香洲区 | 第三 | 797 | |||
| 4 | 香洲区 | 第二 | 1027 | 大岭山 | 第三 | 81 | 新会区 | 第三 | 44 | 沙溪镇 | 第三 | 776 | |||
| 5 | 新会区 | 第三 | 841 | 大涌镇 | 第三 | 51 | 香洲区 | 第三 | 43 | 新会区 | 第三 | 595 | |||
| 6 | 慧阳区 | 第三 | 600 | 惠阳区 | 第三 | 45 | 东升镇 | 第三 | 33 | 惠阳区 | 第三 | 513 | |||
| 7 | 斗门区 | 第三 | 594 | 高要区 | 第三 | 32 | 慧阳区 | 第三 | 32 | 番禺区 | 第三 | 512 | |||
| 8 | 越秀区 | 第三 | 551 | 三水区 | 第三 | 30 | 荔湾区 | 第三 | 16 | 越秀区 | 第三 | 411 | |||
| 9 | 番禺区 | 第三 | 500 | 鼎湖区 | 第三 | 29 | 白云区 | 第三 | 16 | 龙华区 | 第三 | 373 | |||
| 10 | 龙岗区 | 第三 | 422 | 江海区 | 第三 | 27 | 龙岗区 | 第三 | 15 | 天河区 | 第三 | 371 | |||
图5 珠三角地区家具产业链上中下游空间熵分解Fig.5 Spatial quotient decomposition in the upper,middle and lower reaches of the furniture industry chain in the Pearl River Delta region |
| [1] |
齐志明, 王伟健, 宋豪新, 等. 家居产品服务提升供给水平促进消费提档升级[N]. 人民日报,2023 -08- 16(19).
|
| [2] |
徐雪娇, 赵亚奇, 崔学良. 创新驱动下家具产业集群空间演化研究[J]. 林产工业, 2021(5):42-45.
|
| [3] |
陈竞飞, 田刚. 家具产业运营效率与国民经济产业结构耦合协调研究[J]. 经济地理, 2022(7):159-166.
|
| [4] |
朱剑刚, 王旭. 木质家具智能制造赋能技术及发展路径分析[J]. 林业工程学报, 2021(6):177-183.
|
| [5] |
吴智慧, 张雪颖, 徐伟, 等. 智能家具的研究现状与发展趋势[J]. 林产工业, 2017(5):5-8.
|
| [6] |
|
| [7] |
|
| [8] |
黄颖敏, 黄耿志, 刘家玉, 等. 革命老区产业集群协同演化与创新机制——以江西南康家具产业集群为例[J]. 人文地理, 2023(3):138-145.
|
| [9] |
张帅, 袁长伟, 赵小曼. 中国交通运输碳排放空间聚类与关联网络结构分析[J]. 经济地理, 2019, 39(1):122-129.
|
| [10] |
杨建新, 刘静, 龚健, 等. 不同空间聚类算法在识别优质集聚基本农田图斑中的应用及对比研究[J]. 中国土地科学, 2022(1):107-117.
|
| [11] |
杨帆, 徐建刚, 周亮. 基于DBSCAN空间聚类的广州市区餐饮集群识别及空间特征分析[J]. 经济地理, 2016(10):110-116.
|
| [12] |
|
| [13] |
马小宾, 侯国林, 李莉. 国家中心城市共享住宿的时空分布及影响因素——基于DBSCAN算法的分析[J]. 自然资源学报, 2021(10):2694-2709.
|
| [14] |
刘瑞宽, 李九全. 西安市实体书店空间分布特征及影响因素——基于DBSCAN算法的分析[J]. 经济地理, 2021(6):87-96.
|
| [15] |
|
| [16] |
|
| [17] |
|
| [18] |
|
| [19] |
兰峰, 林振宇, 黄歆. 基于POI数据的西安市多中心空间结构演变特征与驱动因素研究[J]. 干旱区资源与环境, 2023 (11):57-66.
|
| [20] |
李江苏, 梁燕, 李小建. 欠发达地区快速增长城市现代服务业空间布局及影响因素——基于POI和问卷数据的郑州市案例分析[J]. 经济地理, 2021, 41(5):145-154.
|
| [21] |
张景奇, 史文宝, 修春亮. POI数据在中国城市研究中的应用[J]. 地理科学, 2021(1):140-148.
|
/
| 〈 |
|
〉 |