
Evolution of Urban Innovation Space and Influencing of Innovation Environment Elements on Innovation Outputs:Evidence from Shenzhen
Received date: 2023-03-28
Revised date: 2023-12-29
Online published: 2024-09-12
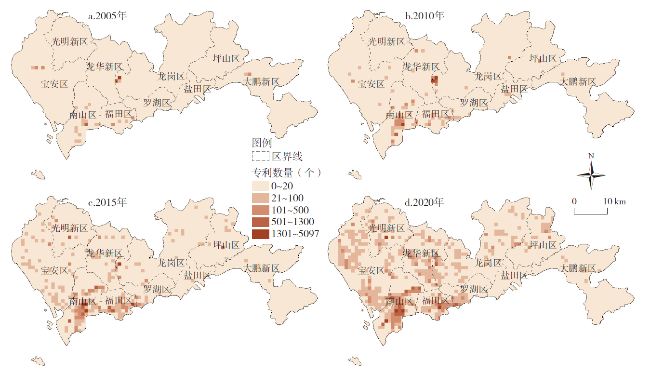
Based on the data of patent application and POI,this study presents the evolution characteristics of innovation space in Shenzhen in four years from the micro-scale (1km×1km cells),and further investigates the influence of various elements of innovation environment on urban innovation space and their changes through the spatial autoregressive Poisson model in 2005-2020. The results show that: 1) The number of patent applications has increased largely in Shenzhen. However,the innovation output presents the phenomenon of spatial imbalance. The innovation spatial structure has experienced the evolution process from "Longgang-Nanshan dual cores" to "Nanshan-Futian dual cores with belts". 2) In terms of innovation production elements,industrial park plays a key role in innovation output,manufacturing enterprises have been replaced by information technology enterprises as the major players contributing innovation outputs in Shenzhen. Meanwhile,universities and scientific research institutes have also played a positive role. 3) In terms of factors related to the spatial location selection of innovation production elements,regional transport facilities,location,and transport accessibility have significantly affected innovation outputs in Shenzhen. Different kinds of public service facilities have influenced innovation outputs differently in terms of time phase.
WANG Bo , XIE Jinyan , WANG Li . Evolution of Urban Innovation Space and Influencing of Innovation Environment Elements on Innovation Outputs:Evidence from Shenzhen[J]. Economic geography, 2024 , 44(4) : 84 -90 . DOI: 10.15957/j.cnki.jjdl.2024.04.009
表1 模型自变量定义及统计值Tab.1 Independent variable definition and statistics |
| 变量 | 描述 | 均值1 | 标准差1 | 预期影响2 |
|---|---|---|---|---|
| 创新环境要素 | ||||
| 高校/科研机构 | 空间单元i在各年份的高校/科研机构数量(个/km2) | 0.17 | 1.17 | + |
| 制造业企业 | 空间单元i在各年份的制造业企业数量(个/km2) | 5.30 | 13.74 | + |
| 信息科技企业 | 空间单元i在各年份的信息科技企业数量(个/km2) | 0.15 | 0.99 | + |
| 文化创意企业 | 空间单元i在各年份的文化创意企业数量(个/km2) | 0.45 | 2.18 | + |
| 产业园区 | 空间单元i的几何中心在各年份到最近产业园区的直线距离(km) | 0.64 | 2.36 | - |
| 区位 | 空间单元i几何中心在各年份到最近区中心的直线距离3(km) | 8.46 | 5.97 | - |
| 区域交通枢纽 | 空间单元i几何中心在各年份到机场/高铁站/火车站的直线距离4(km) | 15.94 | 10.89 | - |
| 公共交通 | 空间单元i在各年份的地铁/公交站点数量(个/km2) | 0.17 | 1.20 | + |
| 文化设施 | 空间单元i在各年份的文化类设施(博物馆、图书馆、美术馆、展览馆等)数量(个/km2) | 0.23 | 1.08 | + |
| 医疗设施 | 空间单元i在各年份的医疗类设施(医院、卫生站等)数量(个/km2) | 0.90 | 2.74 | + |
| 餐饮设施 | 空间单元i在各年份的餐饮类设施(饭店、饮品店等)数量(个/km2) | 13.48 | 40.46 | + |
| 运动设施 | 空间单元i在各年份的运动类设施(运动场馆、健身场馆等)数量(个/km2) | 1.34 | 4.34 | + |
| 休闲设施 | 空间单元i在各年份的休闲类设施(KTV、电影院等)数量(个/km2) | 1.98 | 6.00 | + |
| 生态环境 | 空间单元i的几何中心在各年份到最近绿地/水系的直线距离(km) | 0.55 | 2.53 | - |
| 人口规模 | 空间单元i在各年份的人口规模(万人/km2) | 5872.48 | 8318.54 | |
注:1.根据4个年份所有数据,计算均值与标准差;2.“+”和“-”分别表示该变量对创新产出的预期影响为正向和负向;3.深圳是典型的多中心城市;参照已有研究[33],空间单元的区位是测度其到最近区中心的直线距离;4.取到3类区域交通枢纽直线距离的最小值。 |
表2 深圳市2005—2020年各空间单元创新产出总体变化Tab.2 Variations of the number of patent applications across grids in Shenzhen in 2005-2020 |
| 指标 | 2005 | 2010 | 2015 | 2020 |
|---|---|---|---|---|
| 平均值(件) | 4.18 | 8.74 | 17.50 | 28.48 |
| 极差 | 3353 | 4837 | 5053 | 5097 |
| 标准差 | 82.39 | 128.83 | 164.55 | 176.80 |
| Moran's I指数 | 0.008 | 0.087 | 0.082 | 0.198 |
表3 泊松回归及空间自回归泊松模型结果Tab.3 Results of Poisson and SAR-Poisson models |
| 变量 | 2005 | 2010 | 2015 | 2020 | |||||||
|---|---|---|---|---|---|---|---|---|---|---|---|
| Poisson model 系数(S.E.) | SAR-Poisson model 系数(S.E.) | Poisson model 系数(S.E.) | SAR-Poisson model 系数(S.E.) | Poisson model 系数(S.E.) | SAR-Poisson model 系数(S.E.) | Poisson model 系数(S.E.) | SAR-Poisson model 系数(S.E.) | ||||
| 高校/科研机构 | 0.072(0.060) | 0.068(0.058) | 0.122***(0.040) | 0.102***(0.034) | 0.200***(0.062) | 0.181***(0.067) | 0.241***(0.078) | 0.220***(0.075) | |||
| 制造业企业 | 0.251***(0.071) | 0.230***(0.065) | 0.222***(0.070) | 0.204***(0.072) | 0.181***(0.062) | 0.170***(0.060) | 0.165**(0.050) | 0.155***(0.051) | |||
| 信息科技企业 | 0.100(0.061) | 0.095(0.055) | 0.131***(0.066) | 0.122**(0.060) | 0.165***(0.055) | 0.155***(0.051) | 0.200***(0.066) | 0.191***(0.065) | |||
| 文化创意企业 | 0.041(0.051) | 0.033(0.056) | 0.066(0.047) | 0.060(0.044) | 0.090**(0.040) | 0.077**(0.038) | 0.133**(0.062) | 0.125**(0.059) | |||
| 产业园区 | -0.321**(0.136) | -0.292**(0.126) | -0.331***(0.125) | -0.309***(0.113) | -0.336***(0.126) | -0.311***(0.120) | -0.352***(0.125) | -0.349***(0.122) | |||
| 区位 | -0.200*(0.119) | -0.207*(0.121) | -0.235*(0.124) | -0.237*(0.126) | -0.288**(0.130) | -0.279**(0.127) | -0.312**(0.150) | -0.309**(0.150) | |||
| 区域交通枢纽 | -0.248*(0.127) | -0.229*(0.124) | -0.215**(0.105) | -0.209**(0.102) | -0.200**(0.099) | -0.198**(0.098) | -0.198**(0.091) | -0.196**(0.080) | |||
| 公共交通 | 0.230**(0.102) | 0.214**(0.102) | 0.216**(0.106) | 0.202**(0.100) | 0.220***(0.080) | 0.217***(0.081) | 0.226***(0.084) | 0.219***(0.080) | |||
| 文化设施 | 0.056(0.051) | 0.061(0.052) | 0.060(0.050) | 0.062(0.049) | 0.074*(0.042) | 0.072*(0.040) | 0.079*(0.040) | 0.081*(0.044) | |||
| 医疗设施 | 0.036(0.032) | 0.035(0.030) | 0.060(0.044) | 0.060(0.043) | 0.089**(0.044) | 0.080**(0.040) | 0.091**(0.039) | 0.082**(0.038) | |||
| 餐饮设施 | 0.090**(0.040) | 0.082**(0.039) | 0.102***(0.037) | 0.101***(0.034) | 0.124***(0.044) | 0.122***(0.045) | 0.135***(0.060) | 0.131***(0.058) | |||
| 运动设施 | 0.051(0.055) | 0.036(0.049) | 0.052(0.039) | 0.048(0.034) | 0.060(0.041) | 0.058(0.035) | 0.070*(0.036) | 0.067*(0.035) | |||
| 休闲设施 | 0.084*(0.049) | 0.083*(0.049) | 0.085*(0.044) | 0.082*(0.043) | 0.087*(0.045) | 0.080*(0.045) | 0.088**(0.038) | 0.079**(0.037) | |||
| 生态环境 | 0.052(0.100) | 0.056(0.092) | -0.070(0.092) | -0.068(0.090) | -0.091(0.71) | -0.097(0.073) | -0.111*(0.059) | -0.116*(0.060) | |||
| 人口规模 | 0.200**(0.084) | 0.198**(0.082) | 0.181**(0.079) | 0.180**(0.075) | 0.198***(0.051) | 0.192***(0.049) | 0.190***(0.039) | 0.197***(0.041) | |||
| 0.351***(0.038) | 0.406***(0.033) | 0.446***(0.032) | 0.460***(0.037) | ||||||||
| 样本数 | 986 | 1428 | 1516 | 1586 | |||||||
| Adjusted R2 | 0.253 | 0.361 | 0.271 | 0.416 | 0.327 | 0.457 | 0.397 | 0.515 | |||
注:* p<0.1,** p<0.05,*** p<0.01。 |
| [1] |
|
| [2] |
|
| [3] |
王缉慈. 创新的空间[M]. 北京: 科学出版社, 2019.
|
| [4] |
甄峰, 徐海贤, 朱传耿. 创新地理学:一门新兴的地理学分支学科[J]. 地域研究与开发, 2001, 20(1):9-11.
|
| [5] |
|
| [6] |
杨轩宇, 任胜钢, 靳海攀. 中国287个城市创新的空间分异与溢出效应[J]. 经济地理, 2023, 43(9):52-61.
|
| [7] |
吕拉昌, 赵彩云. 中国城市创新地理研究评述与展望[J]. 经济地理, 2021, 41(3):16-27.
|
| [8] |
赵建吉, 曾刚. 创新的空间测度:数据与指标[J]. 经济地理, 2009, 29(8):1250-1255.
|
| [9] |
王纪武, 刘妮娜. 杭州市9区创新发展潜力评价研究[J]. 经济地理, 2020, 40(11):105-111.
|
| [10] |
|
| [11] |
段德忠, 杜德斌, 刘承良. 上海和北京城市创新空间结构的时空演化模式[J]. 地理学报, 2015, 70(12):1911-1925.
|
| [12] |
孙瑜康, 李国平, 袁薇薇, 等. 创新活动空间集聚及其影响机制研究评述与展望[J]. 人文地理, 2017, 32(5):17-24.
|
| [13] |
|
| [14] |
|
| [15] |
|
| [16] |
|
| [17] |
王波, 甄峰, 朱贤强. 互联网众创空间的内涵及其规划策略——基于上海的调研发现[J]. 城市规划, 2017, 41(9):30-37,121.
|
| [18] |
|
| [19] |
|
| [20] |
|
| [21] |
|
| [22] |
|
| [23] |
|
| [24] |
|
| [25] |
|
| [26] |
孙健, 尤雯. 人才集聚与产业集聚的互动关系研究[J]. 管理世界, 2008, 24(3):177-178.
|
| [27] |
王俊松, 颜燕, 胡曙虹. 中国城市技术创新能力的空间特征及影响因素——基于空间面板数据模型的研究[J]. 地理科学, 2017, 37(1):11-18.
|
| [28] |
王承云, 孙飞翔. 长三角城市创新空间的集聚与溢出效应[J]. 地理研究, 2017, 36(6):1042-1052.
|
| [29] |
孙瑜康, 孙铁山, 席强敏. 北京市创新集聚的影响因素及其空间溢出效应[J]. 地理研究, 2017, 36(12):2419-2431.
|
| [30] |
王波, 雷雅钦, 汪成刚, 等. 建成环境对城市活力影响的时空异质性研究:基于大数据的分析[J]. 地理科学, 2022, 42(2):274-283.
|
| [31] |
中国科学技术信息研究所. 国家创新型城市创新能力评价报告2020[M]. 北京: 科学技术文献出版社, 2020.
|
| [32] |
王波, 甄峰, 张姗琪, 等. 空气污染对城市活力的影响及其建成环境异质性——基于大数据的分析[J]. 地理研究, 2021, 40(7):1935-1948.
|
| [33] |
|
| [34] |
罗小龙, 沈建法. 从“前店后厂”到深港都会:三十年港深关系之演变[J]. 经济地理, 2010, 30(5):711-715.
|
| [35] |
古恒宇, 沈体雁. 中国省级高技能人才迁移的时空演化机制[J]. 地理学报, 2022, 77(10):2457-2473.
|
/
| 〈 |
|
〉 |