
Power Source and Driving Factors of Green Transformation of Resource-Based Cities in China
Received date: 2023-07-11
Revised date: 2024-01-15
Online published: 2024-09-12
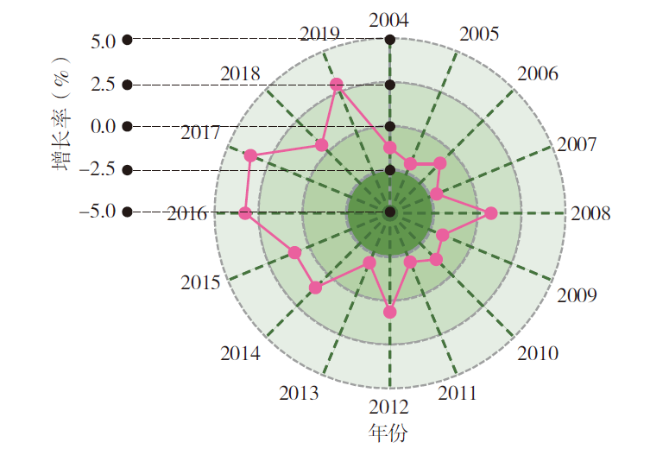
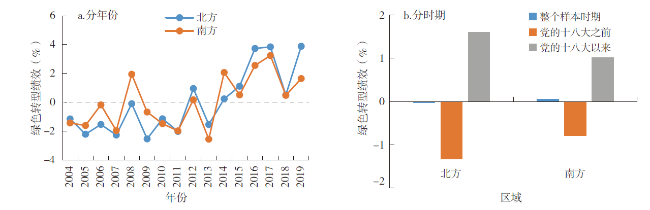
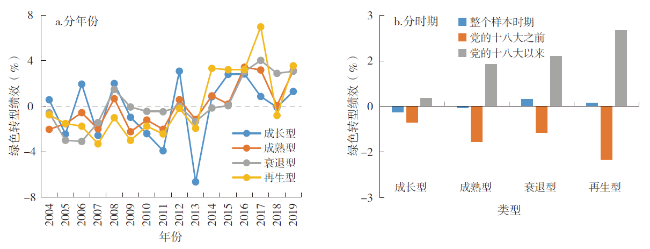
Promoting the green transformation of resource-based cities is an important issue to improve the coordinated development of regions and make up for the shortcomings of transformation. Based on the samples of 111 resource-based cities,this paper reveals the power source and driving factors of green transformation of resource-based cities in China from 2004 to 2019 using the methods of the data envelopment analysis and the quantile regression model. The results show that: 1) The green transformation performance of resource-based cities increased cumulatively by 0.33% in 2004-2019. In terms of distribution location,the green transformation performance of resource-based cities in the south of China is higher than that in the north of China. With regards to development types,the green transformation performance of declining-type cities is higher than that of regenerative-type, mature-type,and growing-type cities. 2) From the perspective of endogenous,technological progress has emerged as a catalyst for promoting growth in the performance of green transformation among resource-based cities,with environmental pollution treatment technology improvements making significant contributions. 3) From the perspective of exogenous,there are notable variations in both size and direction regarding how environmental regulation and industrial structure impact the performance of green transformation across different regions and types of resource-based cities. Notably,employment structure optimization and financial development exert substantial positive effects on the green transformation performance of resource-based cities at each quantile level.
WANG Jue . Power Source and Driving Factors of Green Transformation of Resource-Based Cities in China[J]. Economic geography, 2024 , 44(4) : 75 -83 . DOI: 10.15957/j.cnki.jjdl.2024.04.008
表1 研究区资源型城市类型划分概况Tab.1 Overview of the classification of resource-based cities |
| 成长型 | 成熟型 | 衰退型 | 再生型 |
|---|---|---|---|
| 朔州、呼伦贝尔、鄂尔多斯、松原、贺州、南充、六盘水、昭通、延安、咸阳、榆林、武威、庆阳 | 张家口、承德、邢台、邯郸、大同、阳泉、长治、晋城、忻州、晋中、临汾、运城、吕梁、赤峰、本溪、吉林、黑河、大庆、鸡西、牡丹江、湖州、宿州、亳州、淮南、滁州、池州、宣城、南平、三明、龙岩、赣州、宜春、东营、济宁、泰安、三门峡、鹤壁、平顶山、鄂州、衡阳、郴州、邵阳、娄底、云浮、百色、河池、广元、广安、自贡、攀枝花、达州、雅安、安顺、曲靖、保山、临沧、渭南、宝鸡、金昌、平凉 | 乌海、阜新、抚顺、辽源、白山、伊春、鹤岗、双鸭山、七台河、淮北、铜陵、景德镇、新余、萍乡、枣庄、焦作、濮阳、黄石、韶关、泸州、铜川、白银、石嘴山 | 唐山、包头、鞍山、盘锦、葫芦岛、通化、徐州、宿迁、马鞍山、淄博、临沂、洛阳、南阳、丽江、张掖 |
表2 DEA框架下资源型城市绿色转型绩效测度的指标选取Tab.2 Indicator selection for the green transformation performance measurement of resource-based cities under the DEA framework |
| 类型 | 一级指标 | 二级指标 |
|---|---|---|
| 投入 | 劳动要素(x1) | 三次产业从业人员 |
| 资本要素(x2) | 资本存量 | |
| 绿色要素(x3) | 绿色专利申请授权数量 | |
| 资源要素(x4) | 城市建成区面积、城市供水总量、能源消费量 | |
| 产出 | 经济产出(y) | 以2003年为基期的实际GDP |
| 社会不公(b1) | 城镇居民人均可支配收入/农村居民人均可支配收入 | |
| 环境污染(b2) | 工业废水排放量、工业SO2排放量、PM2.5浓度 |
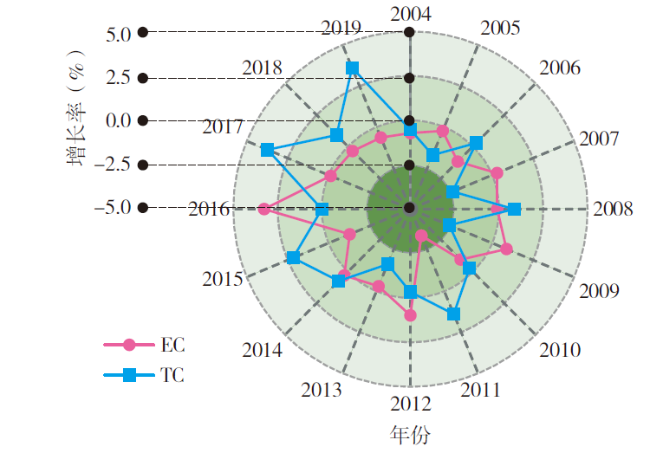
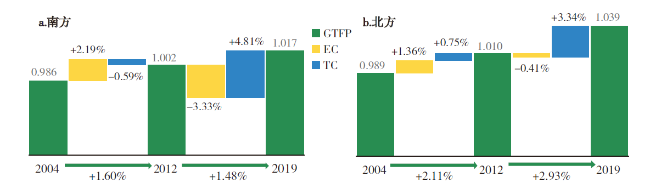
图5 中国两大地区资源型城市绿色转型绩效的动力源泉:基于技术结构Fig.5 Power source of the green transition performance of resource-based cities in two regions of China: based on the technology structure |
表3 中国两大地区资源型城市绿色转型绩效的动力源泉:基于要素结构(单位:%)Tab.3 Power source of the green transition performance of resource cities in two regions of China: based on the factor structure (unit:%) |
| 时期 | 地区 | 分项 | ECx1 | ECx2 | ECx3 | ECx4 | 合计 | ECy | ECb1 | ECb2 | 合计 |
|---|---|---|---|---|---|---|---|---|---|---|---|
| Ⅰ | 南方 | EC | -0.173 | 0.112 | 1.080 | 0.042 | 1.061 | -0.006 | 0.699 | 0.440 | 1.132 |
| 北方 | EC | -0.272 | 0.038 | 0.294 | 0.459 | 0.520 | -0.070 | 0.284 | 0.622 | 0.836 | |
| Ⅱ | 南方 | EC | 0.217 | -0.398 | -1.882 | -0.394 | -2.458 | -0.083 | -0.631 | -0.161 | -0.875 |
| 北方 | EC | 0.110 | 0.044 | -0.371 | -0.236 | -0.454 | -0.144 | -0.387 | 0.573 | 0.043 | |
| 时期 | 地区 | 分项 | TCx1 | TCx2 | TCx3 | TCx4 | 合计 | TCy | TCb1 | TCb2 | 合计 |
| Ⅰ | 南方 | TC | -0.017 | -0.134 | -0.413 | 0.079 | -0.484 | 0.174 | -0.599 | 0.317 | -0.109 |
| 北方 | TC | 0.361 | -0.275 | 0.248 | 0.287 | 0.622 | -0.014 | -0.076 | 0.218 | 0.128 | |
| Ⅱ | 南方 | TC | 0.308 | 0.828 | 1.832 | 0.469 | 3.436 | 0.217 | 0.987 | 0.165 | 1.369 |
| 北方 | TC | 0.218 | 0.645 | 0.588 | 0.267 | 1.718 | 0.524 | 0.791 | 0.303 | 1.617 |
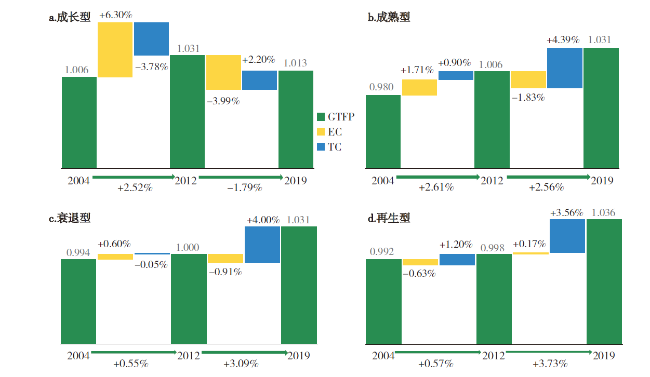
图6 中国4类资源型城市绿色转型绩效的动力源泉:基于技术结构Fig.6 Power source of the green transition performance in four categories of resource-based cities in China: based on technological structure |
表4 中国4类资源型城市绿色转型绩效的动力源泉:基于要素结构(单位:%)Tab.4 Power source of the green transition performance in four categories of resource-based cities in China: based on the factor structure(unit:%) |
| 时期 | 类型 | 分项 | ECx1 | ECx2 | ECx3 | ECx4 | 合计 | ECy | ECb1 | ECb2 | 合计 |
|---|---|---|---|---|---|---|---|---|---|---|---|
| Ⅰ | 成长型 | EC | 0.534 | 1.075 | 1.403 | 1.190 | 4.202 | 0.639 | 0.812 | 0.643 | 2.094 |
| 成熟型 | EC | -0.235 | 0.232 | 0.622 | 0.131 | 0.750 | -0.065 | 0.569 | 0.459 | 0.963 | |
| 衰退型 | EC | -0.788 | -0.659 | 0.745 | 0.297 | -0.405 | -0.409 | 0.218 | 1.194 | 1.003 | |
| 再生型 | EC | -0.024 | -0.338 | -0.261 | 0.110 | -0.513 | 0.009 | 0.060 | -0.182 | -0.113 | |
| Ⅱ | 成长型 | EC | 0.180 | -0.540 | -1.360 | -0.660 | -2.380 | -0.430 | -1.100 | -0.080 | -1.610 |
| 成熟型 | EC | 0.091 | -0.352 | -1.007 | -0.254 | -1.522 | -0.132 | -0.583 | 0.404 | -0.311 | |
| 衰退型 | EC | 0.426 | 0.320 | -1.552 | -0.257 | -1.063 | 0.126 | -0.032 | 0.064 | 0.157 | |
| 再生型 | EC | -0.037 | 0.353 | 0.205 | -0.248 | 0.273 | -0.174 | -0.277 | 0.351 | -0.101 | |
| 时期 | 类型 | 分项 | TCx1 | TCx2 | TCx3 | TCx4 | 合计 | TCy | TCb1 | TCb2 | 合计 |
| Ⅰ | 成长型 | TC | -0.384 | -1.020 | -1.545 | -0.389 | -3.338 | -0.092 | -0.817 | 0.468 | -0.441 |
| 成熟型 | TC | 0.336 | -0.258 | 0.098 | 0.498 | 0.673 | 0.169 | -0.233 | 0.286 | 0.223 | |
| 衰退型 | TC | 0.269 | 0.454 | 0.504 | 0.053 | 1.281 | -0.162 | -0.329 | -0.841 | -1.332 | |
| 再生型 | TC | 0.089 | -0.379 | -0.017 | -0.247 | -0.554 | 0.120 | -0.023 | 1.656 | 1.754 | |
| Ⅱ | 成长型 | TC | -0.122 | 1.170 | 0.790 | -0.004 | 1.834 | 0.194 | 0.842 | -0.668 | 0.367 |
| 成熟型 | TC | 0.379 | 0.703 | 1.033 | 0.321 | 2.436 | 0.470 | 1.042 | 0.446 | 1.958 | |
| 衰退型 | TC | 0.050 | 0.606 | 1.674 | 0.407 | 2.737 | 0.303 | 0.672 | 0.290 | 1.265 | |
| 再生型 | TC | 0.402 | 0.575 | 0.781 | 0.691 | 2.449 | 0.423 | 0.526 | 0.166 | 1.115 |
表5 中国及两大地区资源型城市绿色转型绩效的分位数回归结果Tab.5 Quantile regression results of the green transition performance of resource-based cities in China and two regions |
| 全样本 | 南方地区 | 北方地区 | |||||||||
|---|---|---|---|---|---|---|---|---|---|---|---|
| 25% | 50% | 75% | 25% | 50% | 75% | 25% | 50% | 75% | |||
| lnrgdp | -0.021 (0.032) | 0.028 (0.018) | 0.045 (0.035) | -0.008 (0.059) | -0.048 (0.040) | -0.028 (0.075) | -0.004 (0.047) | 0.058** (0.024) | 0.072* (0.042) | ||
| regulate | -0.039** (0.018) | -0.038*** (0.009) | -0.018** (0.008) | -0.079*** (0.020) | -0.043*** (0.016) | -0.012 (0.020) | 0.008 (0.031) | -0.052*** (0.014) | -0.044*** (0.010) | ||
| Inform | 0.041 (0.066) | 0.088* (0.050) | 0.031 (0.046) | 0.141 (0.135) | 0.191*** (0.065) | 0.073 (0.082) | 0.065 (0.075) | -0.027 (0.049) | -0.006 (0.045) | ||
| urban | -0.011 (0.011) | 0.005 (0.005) | 0.015*** (0.005) | 0.003 (0.020) | 0.009 (0.014) | 0.0004 (0.020) | 0.006 (0.010) | 0.011* (0.006) | 0.022*** (0.005) | ||
| Indust1 | 0.058*** (0.022) | 0.033** (0.016) | 0.027 (0.018) | 0.040 (0.027) | 0.044 (0.027) | 0.020 (0.029) | 0.045 (0.037) | 0.022 (0.029) | 0.048** (0.022) | ||
| Indust2 | 0.001 (0.021) | -0.012 (0.014) | -0.012 (0.012) | 0.068** (0.029) | 0.079*** (0.030) | 0.041 (0.033) | 0.017 (0.027) | -0.011 (0.020) | -0.025 (0.015) | ||
| employ | 0.164*** (0.043) | 0.146*** (0.025) | 0.063*** (0.023) | 0.216*** (0.056) | 0.219*** (0.045) | 0.179*** (0.066) | 0.166** (0.066) | 0.131*** (0.045) | 0.037 (0.032) | ||
| market | -0.052*** (0.015) | -0.031*** (0.007) | 0.013** (0.006) | -0.046** (0.021) | -0.041*** (0.014) | 0.044** (0.020) | -0.091*** (0.021) | -0.050*** (0.011) | -0.001 (0.008) | ||
| finance | 0.020** (0.009) | 0.015*** (0.005) | 0.009** (0.004) | 0.002 (0.017) | -0.002 (0.009) | 0.015 (0.012) | 0.026** (0.011) | 0.027*** (0.007) | 0.022*** (0.006) | ||
| educate | -0.023*** (0.003) | -0.023*** (0.003) | -0.012*** (0.002) | -0.031*** (0.005) | -0.024*** (0.004) | -0.0169*** (0.004) | -0.022*** (0.005) | -0.021*** (0.004) | -0.018*** (0.004) | ||
| 常数项 | 0.956*** (0.126) | 1.058*** (0.088) | 1.023*** (0.076) | 0.600*** (0.173) | 0.529*** (0.179) | 0.599*** (0.217) | 0.857*** (0.177) | 1.067*** (0.122) | 1.134*** (0.098) | ||
| 样本量 | 1887 | 782 | 1105 | ||||||||
| R2 | 0.056 | 0.065 | 0.022 | 0.128 | 0.084 | 0.054 | 0.044 | 0.082 | 0.045 | ||
注:***、**、*分别表示在1%、5%、10%的显著性水平,括号内为标准误,采用Bootstrap方法抽样500次计算而得。表6同。 |
表6 中国4类资源型城市绿色转型绩效的分位数回归结果Tab.6 Quartile regression results of the green transition performance in four categories of resource-based cities in China |
| 成长型 | 成熟型 | 衰退型 | 再生型 | ||||||||||||
|---|---|---|---|---|---|---|---|---|---|---|---|---|---|---|---|
| 25% | 50% | 75% | 25% | 50% | 75% | 25% | 50% | 75% | 25% | 50% | 75% | ||||
| lnrgdp | -0.271*** (0.059) | -0.382** (0.182) | -0.103 (0.227) | 0.379 (0.463) | 0.417** (0.202) | 0.287 (0.305) | 0.082 (2.209) | 3.373* (1.713) | 3.581*** (0.975) | 2.058** (1.003) | 1.836* (0.996) | 0.714 (0.643) | |||
| regulate | -0.055 (0.040) | -0.088** (0.039) | -0.058** (0.028) | -0.049** (0.019) | -0.044*** (0.012) | -0.040*** (0.011) | 0.104** (0.049) | 0.055 (0.051) | 0.003 (0.026) | 0.052 (0.080) | 0.031 (0.038) | 0.045 (0.031) | |||
| Inform | 0.062 (0.132) | 0.179 (0.355) | 0.337 (0.328) | 0.119* (0.064) | 0.154*** (0.043) | 0.085* (0.044) | -0.088 (0.368) | -0.357 (0.282) | -0.124 (0.113) | -0.804** (0.355) | -0.339 (0.285) | -0.020 (0.138) | |||
| urban | 0.011* (0.006) | 0.025*** (0.007) | 0.028*** (0.006) | -0.003 (0.015) | 0.013 (0.011) | 0.018*** (0.005) | -0.036 (0.034) | -0.010 (0.026) | -0.021 (0.016) | 0.049** (0.021) | 0.002 (0.013) | 0.007 (0.009) | |||
| Indust1 | 0.072 (0.044) | 0.059 (0.052) | 0.043 (0.044) | 0.048* (0.026) | 0.040 (0.025) | 0.036* (0.020) | 0.048 (0.095) | 0.019 (0.067) | 0.001 (0.047) | 0.218 (0.164) | -0.135 (0.104) | -0.047 (0.086) | |||
| Indust2 | -0.122*** (0.043) | -0.181*** (0.045) | -0.181*** (0.036) | 0.024 (0.027) | 0.001 (0.018) | -0.013 (0.016) | 0.006 (0.072) | -0.038 (0.065) | -0.071* (0.038) | 0.126** (0.060) | -0.009 (0.051) | 0.039 (0.039) | |||
| employ | -0.215* (0.116) | -0.072 (0.132) | -0.004 (0.096) | 0.338*** (0.077) | 0.291*** (0.041) | 0.199*** (0.042) | -0.185 (0.139) | 0.067 (0.116) | 0.045 (0.066) | 0.429*** (0.131) | 0.379*** (0.092) | 0.144 (0.092) | |||
| market | -0.017 (0.034) | 0.052 (0.040) | 0.078** (0.038) | -0.069*** (0.017) | -0.053*** (0.009) | 0.001 (0.011) | -0.014 (0.061) | -0.056* (0.031) | -0.032* (0.016) | -0.044 (0.049) | -0.055** (0.027) | -0.036 (0.022) | |||
| finance | -0.001 (0.017) | 0.003 (0.024) | 0.007 (0.024) | 0.004 (0.008) | 0.009 (0.007) | 0.008 (0.006) | 0.057*** (0.017) | 0.052** (0.021) | 0.029** (0.011) | 0.123*** (0.034) | 0.090*** (0.025) | 0.035** (0.016) | |||
| educate | -0.010 (0.009) | -0.014** (0.007) | -0.014** (0.006) | -0.024*** (0.004) | -0.027*** (0.002) | -0.021*** (0.004) | -0.023* (0.012) | 0.002 (0.014) | 0.015* (0.008) | -0.084*** (0.016) | -0.054*** (0.011) | -0.022** (0.010) | |||
| 常数项 | 1.903*** (0.249) | 2.118*** (0.290) | 2.004*** (0.222) | 0.775*** (0.181) | 0.949*** (0.116) | 1.013*** (0.110) | 0.839* (0.507) | 1.129*** (0.430) | 1.387*** (0.246) | -0.170 (0.414) | 0.876*** (0.322) | 0.693*** (0.253) | |||
| 样本量 | 221 | 1020 | 391 | 255 | |||||||||||
| R2 | 0.285 | 0.212 | 0.307 | 0.118 | 0.131 | 0.045 | 0.081 | 0.038 | 0.111 | 0.174 | 0.130 | 0.033 | |||
| [1] |
余建辉, 李佳洺, 张文忠. 中国资源型城市识别与综合类型划分[J]. 地理学报, 2018, 73(4):677-687.
|
| [2] |
|
| [3] |
彭定洪, 李旭锋. 资源型城市绿色转型成效评价研究——以云南省为例[J]. 城市问题, 2023(7):21-32.
|
| [4] |
谭俊涛, 张新林, 刘雷, 等. 中国资源型城市转型绩效测度与评价[J]. 经济地理, 2020, 40(7):57-64.
|
| [5] |
|
| [6] |
王晓楠, 孙威. 黄河流域资源型城市转型效率及其影响因素[J]. 地理科学进展, 2020, 39(10):1643-1655.
|
| [7] |
|
| [8] |
|
| [9] |
杨骞, 刘鑫鹏, 孙淑惠. 中国科技创新效率的区域差异及其成因识别——基于重大国家区域发展战略[J]. 科学学研究, 2022, 40(5):927-937.
|
| [10] |
李博, 秦欢, 孙威. 产业转型升级与绿色全要素生产率提升的互动关系——基于中国116个地级资源型城市的实证研究[J]. 自然资源学报, 2022, 37(1):186-199.
|
| [11] |
|
| [12] |
张文忠, 余建辉, 王岱, 等. 中国资源型城市可持续发展研究[M]. 北京: 科学出版社, 2014.
|
| [13] |
杨骞, 王珏, 李超, 等. 中国农业绿色全要素生产率的空间分异及其驱动因素[J]. 数量经济技术经济研究, 2019, 36(10):21-37.
|
| [14] |
王珏, 李琳. 国家重大区域发展战略视角下资源型城市绿色转型绩效的地区差距及其政策启示[J]. 自然资源学报, 2023, 38(12):3041-3057.
|
| [15] |
史丹, 李少林. 排污权交易制度与能源利用效率——对地级及以上城市的测度与实证[J]. 中国工业经济, 2020(9):5-23.
|
| [16] |
徐维祥, 郑金辉, 周建平, 等. 资源型城市转型绩效特征及其碳减排效应[J]. 自然资源学报, 2023, 38(1):39-57.
|
| [17] |
盛来运, 郑鑫, 周平, 等. 我国经济发展南北差距扩大的原因分析[J]. 管理世界, 2018, 34(9):16-24.
|
| [18] |
赵传松, 刘华军. 基于城市群视角的中国经济发展南北差距研究[J]. 中国人口·资源与环境, 2023, 33(2):134-142.
|
| [19] |
林伯强, 谭睿鹏. 中国经济集聚与绿色经济效率[J]. 经济研究, 2019, 54(2):119-132.
|
| [20] |
赵涛, 张智, 梁上坤. 数字经济、 创业活跃度与高质量发展——来自中国城市的经验证据[J]. 管理世界, 2020, 36(10):65-76.
|
| [21] |
李虹, 邹庆. 环境规制、 资源禀赋与城市产业转型研究——基于资源型城市与非资源型城市的对比分析[J]. 经济研究, 2018, 53(11):182-198.
|
| [22] |
孙晓华, 任俊林. 资源税改革推动了城市经济增长与产业结构转型吗?[J]. 南开经济研究, 2023,(1):82-100.
|
| [23] |
李珂, 王志刚. 地方财政收入流动性的区域差异——基于城市财政收入数据[J]. 世界经济文汇, 2022(5):53-68.
|
| [24] |
邓翔, 张卫. 大城市加重地区环境污染了吗?[J]. 北京理工大学学报:社会科学版, 2018, 20(1):36-44.
|
| [25] |
姚璐, 王书华, 范瑞. 资源依赖视角下金融集聚对绿色全要素生产率的影响[J]. 资源科学, 2023, 45(2):308-321.
|
/
| 〈 |
|
〉 |