
The Impact of Regional Integration on Carbon Emissions in the Yangtze River Delta:A Multidimensional Perspective
Received date: 2023-09-13
Revised date: 2024-02-10
Online published: 2024-09-12
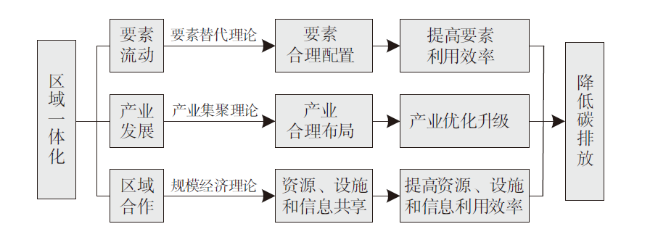
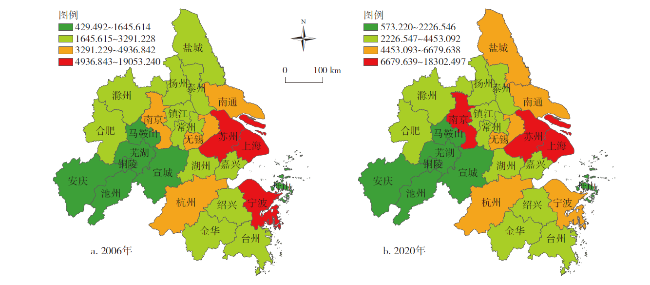
Based on the multi-dimensional perspective,the investigation of the impact of regional integration on carbon emissions is helpful to promote the coordinated development of regional integration and carbon emission,and promote the ecological-green integrated development in the Yangtze River Delta. Based on the model of entropy method and the bivariate Local Moran's Ii,this paper analyzes the spatial-temporal characteristics of regional integration and carbon emissions in the Yangtze River Delta from 2006 to 2020,and constructs a spatial lag panel model to investigate the influential factors of carbon emissions. The results show that: 1) There were obvious regional differences and stable spatial pattern in regional integration and carbon emissions,and the overall spatial pattern was decreasing from the provincial capital cities to the surrounding areas. Shanghai,Nanjing,Hangzhou,Suzhou,Nantong,Wuxi and Ningbo were at relatively higher levels of regional integration and carbon emissions. 2) A significantly positive correlation between regional integration and carbon emissions generally showed a fluctuated decreasing trend. A significantly positive spatial correlation between regional integration and carbon emissions in neighboring cities fluctuated upward. The spatial correlation between the regional integration of cities and the carbon emissions of neighboring cities was relatively stable in the Yangtze River Delta. 3) The results of the spatial lag panel model showed that optimizing the development integration structure was an important way to reduce the carbon emissions. Meanwhile,space integration,factor integration,per capita GDP and the proportion of foreign direct investment in GDP had a markedly negative impact on reducing carbon emissions. The energy consumption per unit of GDP had a markedly positive impact on reducing carbon emissions.
LI Jianbao , CHEN Hongmei , MENG Hao , HUANG Xianjin , CHUAI Xiaowei , LI Ying . The Impact of Regional Integration on Carbon Emissions in the Yangtze River Delta:A Multidimensional Perspective[J]. Economic geography, 2024 , 44(4) : 43 -54 . DOI: 10.15957/j.cnki.jjdl.2024.04.005
表1 长三角区域一体化指标体系与权重Tab.1 Indicator system and weights of regional integration in the Yangtze River Delta |
| 目标层 | 二级指标 | 三级指标 | ||||
|---|---|---|---|---|---|---|
| 内容 | 权重 | 内容 | 指标 | 权重 | ||
| 区域一体化 | 空间一体化 | 0.366 | 绿地 | 绿地面积(km2) | 0.129 | |
| 医疗 | 医疗床位数(张) | 0.059 | ||||
| 教育 | 专任教师数(人) | 0.042 | ||||
| 文化 | 公共图书(千册) | 0.136 | ||||
| 要素一体化 | 0.513 | 人口流动 | 客运总量(万人) | 0.047 | ||
| 货物流动 | 货运总量(万t) | 0.049 | ||||
| 资金流动 | 金融机构存贷款总额(亿元) | 0.120 | ||||
| 信息流动 | 邮电业务总量(亿元) | 0.134 | ||||
| 技术流动 | 科学研究就业人员(万人) | 0.163 | ||||
| 发展一体化 | 0.121 | 经济水平 | 人均GDP(元) | 0.037 | ||
| 经济开放度 | 外商直接投资占GDP比例(%) | 0.028 | ||||
| 投资规模 | 固定资产投资(亿元) | 0.042 | ||||
| 产业结构 | 第三产业比例(%) | 0.014 | ||||
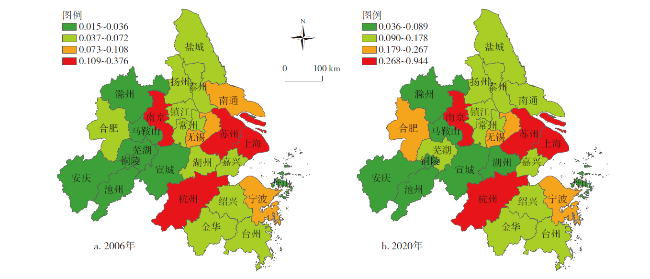
图2 2006—2020年长三角区域一体化指数变化Fig.2 Change of regional integration index in the Yangtze River Delta in 2006-2020 |
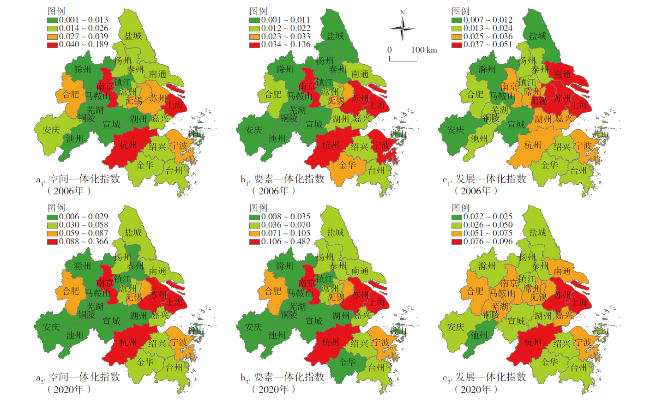
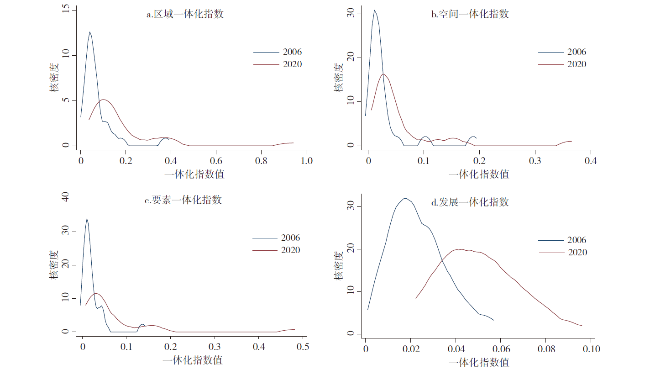
图3 2006—2020年长三角各维度一体化指数变化Fig.3 Change of each dimension of regional integration index in the Yangtze River Delta in 2006-2020 |
表2 2006—2020年长三角区域一体化与碳排放双变量Moran's ITab.2 The bivariate Moran's I between regional integration and carbon emissions in 2006-2020 |
| 年份 | 区域一体化 | 空间一体化 | 要素一体化 | 发展一体化 |
|---|---|---|---|---|
| 2006 | 0.141** | 0.093** | 0.154** | 0.216** |
| 2007 | 0.151** | 0.104** | 0.164** | 0.224** |
| 2008 | 0.139** | 0.111** | 0.143** | 0.187** |
| 2009 | 0.134** | 0.120** | 0.132** | 0.160** |
| 2010 | 0.139** | 0.127** | 0.134** | 0.161** |
| 2011 | 0.144** | 0.133** | 0.128** | 0.183** |
| 2012 | 0.143** | 0.140** | 0.118** | 0.171** |
| 2013 | 0.154** | 0.153** | 0.131** | 0.172** |
| 2014 | 0.163** | 0.157** | 0.155** | 0.169** |
| 2015 | 0.168** | 0.157** | 0.171** | 0.160** |
| 2016 | 0.161** | 0.150** | 0.160** | 0.165** |
| 2017 | 0.164** | 0.155** | 0.159** | 0.179** |
| 2018 | 0.167** | 0.157** | 0.168** | 0.170** |
| 2019 | 0.171** | 0.153** | 0.182** | 0.154** |
| 2020 | 0.173** | 0.149** | 0.186** | 0.165** |
表3 空间滞后面板模型结果Tab.3 Results of spatial lag panel model |
| 变量 | 回归系数 | 变量 | 回归系数 |
|---|---|---|---|
| 空间一体化 | -0.107*** | 单位GDP能耗 | 0.068*** |
| 要素一体化 | -0.122*** | 人均GDP | -0.073*** |
| 发展一体化 | 0.159*** | 外商直接投资占GDP比例 | -0.093*** |
| 城镇化水平 | 0.001 | ρ | 0.124*** |
| 第二产业比例 | 0.015 | R2 | 0.974 |
| 人口密度 | 0.009 |
注:ρ表示空间自回归系数。 |
表4 空间滞后面板模型的直接效应与间接效应Tab.4 Direct and indirect effects of spatial lag panel model |
| 变量 | 直接效应 | 间接效应 | 总效应 |
|---|---|---|---|
| 空间一体化 | -0.108*** | -0.015 | -0.123*** |
| 要素一体化 | -0.120*** | -0.017* | -0.137*** |
| 发展一体化 | 0.160*** | 0.033** | 0.193*** |
| 城镇化水平 | 0.002 | 0.001 | 0.003 |
| 第二产业比例 | 0.016 | 0.002 | 0.018 |
| 人口密度 | 0.008 | 0.001 | 0.009 |
| 单位GDP能耗 | 0.069*** | 0.010 | 0.079*** |
| 人均GDP | -0.074*** | -0.024** | -0.098*** |
| 外商直接投资占GDP比例 | -0.092*** | -0.023** | -0.115*** |
| [1] |
|
| [2] |
方创琳, 周成虎, 顾朝林, 等. 特大城市群地区城镇化与生态环境交互耦合效应解析的理论框架及技术路径[J]. 地理学报, 2016, 71(4):531-550.
|
| [3] |
|
| [4] |
方叶林, 程雪兰, 苏雪晴, 等. 一体化进程对旅游经济的空间溢出效应——以长三角城市群为例[J]. 地理科学, 2021, 41(9):1546-1555.
|
| [5] |
|
| [6] |
|
| [7] |
|
| [8] |
|
| [9] |
胡艳, 张安伟. 长三角区域一体化生态优化效应研究[J]. 城市问题, 2020(6):20-28.
|
| [10] |
葛堃, 邹珊, 卢新海, 等. 区域一体化背景下城市土地绿色利用效率空间收敛分析——以长江经济带为例[J]. 华东经济管理, 2021, 35(3):31-41.
|
| [11] |
晏清, 贺超飞, 郭焕修. 基于区域一体化的长三角城市碳达峰实证研究[J]. 世界经济与政治论坛, 2022(3):150-172.
|
| [12] |
林妍如. 长三角地区一体化背景下产业转移所带来碳排放转移问题的思考[J]. 中国储运, 2022(5):67-68.
|
| [13] |
郭艺, 曹贤忠, 魏文栋, 等. 长三角区域一体化对城市碳排放的影响研究[J]. 地理研究, 2022, 41(1):181-192.
|
| [14] |
|
| [15] |
黎文勇, 杨上广, 吴玉鸣. 区域市场一体化对碳排放效益的影响研究——来自长三角地区的空间计量分析[J]. 软科学, 2018, 32(9):52-55,71.
|
| [16] |
陈益鑫, 季栋伟, 张体委, 等. 区域一体化对三大城市群碳排放强度的影响研究[J]. 金融纵横, 2021(9):85-93.
|
| [17] |
|
| [18] |
|
| [19] |
|
| [20] |
|
| [21] |
|
| [22] |
|
| [23] |
崔丹, 卜晓燕, 徐祯, 等. 中国资源型城市高质量发展综合评估及影响机理[J]. 地理学报, 2021, 76(10):2489-2503.
|
| [24] |
|
| [25] |
|
| [26] |
|
| [27] |
李建豹, 黄贤金, 孙树臣, 等. 长三角地区城市土地与能源消费CO2排放的时空耦合分析[J]. 地理研究, 2019, 38(9):2188-2201.
|
/
| 〈 |
|
〉 |