
The Interaction Relationship and Difference Between Household Consumption Upgrading and Tourism Consumption Structure in China
Received date: 2023-10-09
Revised date: 2024-02-05
Online published: 2024-09-12
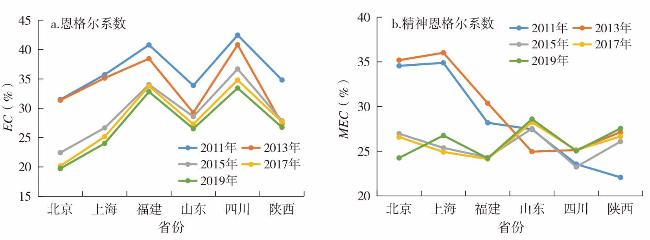
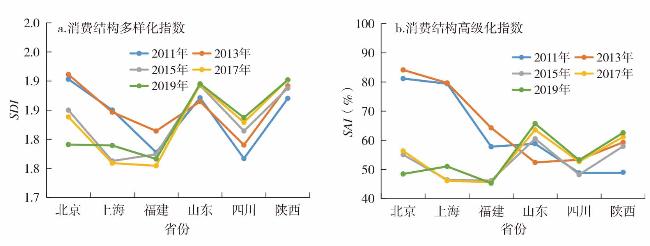
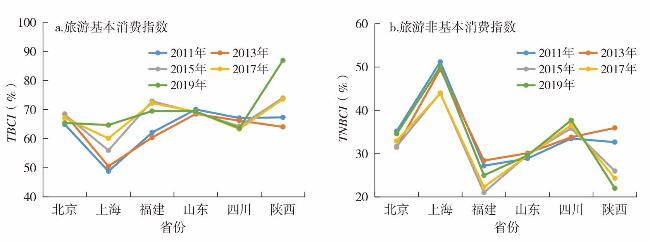
Based on the panel data of six provincial-level regions from 2010 to 2019,this paper introduces seven core indicators to measure the spatial and temporal differences between the household consumption and the tourism consumption structure,and uses PVAR model to analyze their interaction relationship,influence mechanism and regional response. The results show that: 1) Household consumption and tourism consumption structure are upgraded synchronously in developed provincial-level regions. Beijing and Shanghai have higher consumption diversification (1.8~1.9),higher advanced structure (80%~85%) and higher tourism consumption structure index (0.87~1.00),followed by Fujian and Shandong,Sichuan and Shaanxi are both at the lowest levels. 2) There is a two-way win-win interaction effect between household consumption and tourism consumption structure,and the interaction influence is lasting and the structure is stable,that is,consumption upgrading is the driving force to promote tourism consumption upgrading,and it is also influenced by tourism consumption upgrading,but the former is stronger than the latter. 3) Tourism consumption in backward areas is more sensitive to household demand consumption and consumption diversification,and tourism development drives consumption upgrading. The consumption space of residents in developed areas has expanded the tourism consumption scene,thus achieving coordinated growth. Promoting the deep integration of tourism and household life forms is conducive to the realization of tourism development leading to the improvement of urban consumption quality,and forming a new development pattern of all-domain integration,sharing of hosts and guests,and two-way empowerment.
XING Di , SUN Gennian . The Interaction Relationship and Difference Between Household Consumption Upgrading and Tourism Consumption Structure in China[J]. Economic geography, 2024 , 44(3) : 197 -208 . DOI: 10.15957/j.cnki.jjdl.2024.03.020
表1 6个省份国内旅游接待量及国内旅游总收入Tab.1 Domestic tourism reception and gross domestic tourism income in 6 provincial-level regions |
| 年份 | 国内旅游接待总人数(万人次) | 国内旅游总收入(亿元) | |||||||||||
|---|---|---|---|---|---|---|---|---|---|---|---|---|---|
| 北京 | 上海 | 福建 | 山东 | 四川 | 陕西 | 北京 | 上海 | 福建 | 山东 | 四川 | 陕西 | ||
| 2011 | 20884.0 | 23079.0 | 14230.0 | 41696.0 | 34977.8 | 18135.0 | 2864.3 | 2786.5 | 1399.8 | 3573.7 | 2410.6 | 1240.0 | |
| 2013 | 24738.8 | 25990.7 | 19542.0 | 54262.0 | 48700.0 | 28161.0 | 3666.3 | 2968.0 | 2003.4 | 5014.7 | 3830.0 | 2031.0 | |
| 2015 | 26859.0 | 27569.0 | 26129.0 | 65045.4 | 58500.6 | 38274.0 | 4320.0 | 3004.7 | 2798.2 | 6505.1 | 6137.6 | 2904.0 | |
| 2017 | 29353.6 | 31845.0 | 37534.0 | 77966.2 | 66924.0 | 51900.6 | 5122.4 | 4025.1 | 4570.8 | 8491.5 | 8825.4 | 4630.0 | |
| 2019 | 31833.0 | 36141.0 | 52697.1 | 93288.0 | 75081.6 | 70200.0 | 5866.2 | 4789.3 | 7393.4 | 10851.3 | 11454.5 | 6978.9 | |
表2 PVAR模型GMM估计结果Tab.2 GMM estimation results of PVAR model |
| 冲击变量 | 反应变量 | ||||
|---|---|---|---|---|---|
| h_dTBCI | h_dEC | h_dMEC | h_dSDI | h_dSAI | |
| L.h_dTBCI | 0.161** | 0.143** | 0.087 | -0.079 | -0.040 |
| L.h_dEC | 0.719*** | 0.003*** | - | - | - |
| L.h_dMEC | -0.007 | - | 0.001 | - | - |
| L.h_dSDI | 0.002 | - | 0.019 | - | |
| L.h_dSAI | 0.034 | - | - | - | -0.086 |
| 冲击变量 | 反应变量 | ||||
| h_dTNBCI | h_dEC | h_dMEC | h_dSDI | h_dSAI | |
| L.h_dTNBCI | -0.121 | 0.208*** | 0.173*** | -0.180** | 0.970** |
| L.h_dEC | 0.227 | 0.063 | - | - | - |
| L.h_dMEC | 0.192 | - | -0.029 | - | - |
| L.h_dSDI | -0.198 | - | -0.009 | - | |
| L.h_dSAI | 1.057*** | - | - | - | 0.995** |
| 冲击变量 | 反应变量 | ||||
| h_dTCSI | h_dEC | h_dMEC | h_dSDI | h_dSAI | |
| L.h_dTCSI | 0.121*** | 0.679*** | 0.176*** | -0.207** | 0.051** |
| L.h_dEC | -0.120** | -0.263** | - | - | - |
| L.h_dMEC | 0.163** | - | 0.085 | - | - |
| L.h_dSDI | -0.171** | - | 0.123 | - | |
| L.h_dSAI | 0.009** | - | - | - | -0.185 |
注:*、**、***分别表示在10%、5%、1%的水平上统计显著。 |
表3 PVAR模型的Granger因果检验结果Tab.3 Granger causality test results for the PVAR model |
| 零假设 | Hcs的卡方检验 | 结论 | ||||
|---|---|---|---|---|---|---|
| EC | MEC | SDI | SAI | |||
| Hcs非TBCI的Granger原因 | 56.238*** | 0.876 | 0.556 | 0.072 | EC拒绝,MEC、SDI、SAI接受 | |
| TBCI非Hcs的Granger原因 | 63.5*** | 0.004 | 0.001 | 0.174 | EC拒绝,MEC、SDI、SAI接受 | |
| Hcs非TNBCI的Granger原因 | 6.782*** | 8.115*** | 5.431** | 17.683*** | 均拒绝 | |
| TNBCI非Hcs的Granger原因 | 1.430 | 1.260 | 1.295 | 23.446*** | EC、MEC、SDI接受,SAI拒绝 | |
| Hcs非TCSI的Granger原因 | 35.919*** | 6.634*** | 6.025** | 6.971** | 均拒绝 | |
| TCSI非Hcs的Granger原因 | 10.186** | 5.401** | 5.639** | 14.626** | 均拒绝 | |
表4 旅游消费结构变动冲击居民消费结构的模型方差分解结果(单位:%)Tab.4 Model decomposition results of the tourism consumption structure variation on the household consumption structure (unit:%) |
| 期数 | 被冲击变量 | 冲击变量 | |||||
|---|---|---|---|---|---|---|---|
| TNBCI | TCSI | ||||||
| Ⅰ | Ⅱ | Ⅲ | Ⅰ | Ⅱ | Ⅲ | ||
| 1 | EC | 17.8 | 1.1 | 4.1 | 19.2 | 0.8 | 4.2 |
| MEC | 10.2 | 0.1 | 4.3 | 12.7 | 29.8 | 1.0 | |
| SDI | 5.3 | 0.4 | 7.0 | 5.6 | 0.4 | 5.6 | |
| SAI | 9.5 | 0.4 | 0.2 | 12.0 | 0.2 | 0.1 | |
| 3 | EC | 18.1 | 1.2 | 4.7 | 19.5 | 1.1 | 4.5 |
| MEC | 10.1 | 0.1 | 5.1 | 12.6 | 29.8 | 1.1 | |
| SDI | 5.3 | 0.4 | 7.6 | 5.6 | 0.4 | 5.6 | |
| SAI | 9.5 | 0.4 | 0.2 | 11.8 | 0.2 | 0.1 | |
| 4 | EC | 18.3 | 1.2 | 4.8 | 20.0 | 1.1 | 4.6 |
| MEC | 10.3 | 0.1 | 5.4 | 13.1 | 29.8 | 1.2 | |
| SDI | 5.4 | 0.4 | 7.7 | 5.8 | 0.4 | 5.8 | |
| SAI | 9.5 | 0.4 | 0.3 | 12.2 | 0.2 | 0.1 | |
| 5 | EC | 18.4 | 1.2 | 4.8 | 20.1 | 1.1 | 4.6 |
| MEC | 10.3 | 0.1 | 5.5 | 13.1 | 29.8 | 1.2 | |
| SDI | 5.4 | 0.4 | 7.7 | 5.8 | 0.4 | 5.8 | |
| SAI | 9.5 | 0.4 | 0.3 | 12.2 | 0.2 | 0.1 | |
注:表中Ⅰ、Ⅱ、Ⅲ分别表示发达省份、较发达省份和相对落后省份,表5同。本文选取预测期数为1、5、10和20期,由于研究结果表明在第5期之后各变量的方差分解结果相同,表明波动态势渐趋平稳,受篇幅限制仅展示了前5期的结果,若有需要详细数据可向作者索取。 |
表5 居民消费结构变动冲击旅游消费结构的模型方差分解结果(单位:%)Tab.5 Model decomposition results of the household consumption structurevariation on the tourism consumption structure (unit:%) |
| 期数 | 被冲击变量 | 冲击变量 | |||||||||||
|---|---|---|---|---|---|---|---|---|---|---|---|---|---|
| EC | MEC | SDI | SAI | ||||||||||
| Ⅰ | Ⅱ | Ⅲ | Ⅰ | Ⅱ | Ⅲ | Ⅰ | Ⅱ | Ⅲ | Ⅰ | Ⅱ | Ⅲ | ||
| 1 | TNBCI | 0.1 | 1.7 | 25.8 | 0.2 | 24.0 | 1.8 | 1.1 | 11.7 | 52.2 | 0.3 | 16.8 | 11.1 |
| TCSI | 0 | 5.1 | 32.8 | 0 | 12.7 | 6.0 | 1.0 | 16.8 | 47.8 | 0 | 20.6 | 9.1 | |
| 2 | TNBCI | 5.3 | 6.8 | 25.1 | 5.9 | 39.8 | 1.5 | 1.3 | 12.1 | 51.5 | 5.5 | 28.8 | 9.8 |
| TCSI | 8.8 | 20.8 | 33.1 | 9.3 | 13.6 | 5.5 | 3.5 | 16.8 | 47.6 | 9.0 | 29.1 | 8.5 | |
| 3 | TNBCI | 5.4 | 7.5 | 25.0 | 5.8 | 41.0 | 1.4 | 1.3 | 12.1 | 51.5 | 5.4 | 29.2 | 9.6 |
| TCSI | 8.8 | 23.9 | 33.2 | 9.0 | 13.6 | 5.4 | 3.5 | 16.8 | 47.6 | 8.7 | 29.4 | 8.5 | |
| 4 | TNBCI | 5.4 | 7.6 | 25.0 | 5.9 | 41.1 | 1.4 | 1.3 | 12.1 | 51.5 | 5.5 | 29.2 | 9.5 |
| TCSI | 9.1 | 24.7 | 33.2 | 9.3 | 13.6 | 5.4 | 3.6 | 16.8 | 47.6 | 9.0 | 29.4 | 8.5 | |
| 5 | TNBCI | 5.5 | 7.6 | 25.0 | 5.9 | 41.1 | 1.4 | 1.3 | 12.1 | 51.5 | 5.5 | 29.2 | 9.5 |
| TCSI | 9.1 | 24.9 | 33.2 | 9.3 | 13.6 | 5.4 | 3.6 | 16.8 | 47.6 | 9.0 | 29.4 | 8.5 | |
| [1] |
孙九霞. 中国旅游消费的日常化与惯性化[J]. 旅游学刊, 2020, 35(3):1-4.
|
| [2] |
刘佳, 王娟, 奚一丹. 中国旅游经济增长质量的空间格局演化[J]. 经济管理, 2016, 38(8):160-173.
|
| [3] |
王兆峰, 刘婷. 国家级夜间文旅消费区空间格局与旅游高质量发展研究[J]. 中南林业科技大学学报:社会科学版, 2023, 17(1):101-110.
|
| [4] |
宋瑞. 经济新发展格局下促进旅游消费的思路与方向[J]. 旅游学刊, 2021, 36(1):3-5.
|
| [5] |
李在军, 管卫华, 吴启焰, 等. 1978—2011年间中国区域消费水平的时空演变[J]. 地球信息科学学报, 2014, 16 (5):746-753.
|
| [6] |
陈友军. 我国居民旅游消费与消费升级协同发展关系探讨[J]. 商业经济研究, 2023(12):55-58.
|
| [7] |
王冉. 家庭文化资本、文化消费与居民旅游消费[J]. 统计与决策, 2022, 38(6):90-94.
|
| [8] |
|
| [9] |
|
| [10] |
|
| [11] |
|
| [12] |
孙虹乔. 中国城乡居民旅游消费与经济增长的实证检验[J]. 统计与决策, 2012(7):101-104.
|
| [13] |
余凤龙, 黄震方, 方叶林. 中国农村居民旅游消费特征与影响因素分析[J]. 地理研究, 2013, 32(8):1565-1576.
|
| [14] |
庞世明. 中国旅游消费函数实证研究——兼与周文丽、李世平商榷[J]. 旅游学刊, 2014, 29(3):31-39.
|
| [15] |
席建超, 甘萌雨, 吴普, 等. 中国入境游客旅游消费总体趋势与区域差异:1996-2005年[J]. 地理研究, 2010, 29(4):737-747.
|
| [16] |
刁宗广. 中国农村居民旅游消费水平及区域差异研究[J]. 地理科学, 2009, 29(2):195-199.
|
| [17] |
刘佳, 张洪香. 中国沿海地区旅游消费潜力测度与评价[J]. 地理与地理信息科学, 2018, 34(2):94-100.
|
| [18] |
孙根年, 侯芳芳. 旅游消费增长对拉动国民消费的贡献:以浙江为例[J]. 旅游学刊, 2010, 25(10):31-36.
|
| [19] |
苏建军, 张毓, 孙根年. 中国旅游消费对经济增长的拉动效应与贡献度分析[J]. 消费经济, 2016, 32(1):34-40.
|
| [20] |
吴晓山. 旅游消费结构变迁下的我国地区商贸业发展转变研究[J]. 商业经济研究, 2022(18):34-37.
|
| [21] |
王钦安, 孙根年. 内蒙古入境旅游消费结构变化及其对国民消费的贡献[J]. 地域研究与开发, 2016, 35(5):94-99.
|
| [22] |
郭文. 空间的生产与分析:旅游空间实践和研究的新视角[J]. 旅游学刊, 2016, 31(8):29-39.
|
| [23] |
林晓珊. 增长中的不平等:从消费升级到消费分层[J]. 浙江学刊, 2017(3):112-120.
|
| [24] |
刘晓萌. 消费升级促进旅游高质量发展的路径研究[J]. 现代商业, 2024(2):40-43.
|
| [25] |
杨懿, 廉倩文, 丁玲, 等. 国家级夜间文旅消费集聚区空间分布特征及影响因素[J]. 经济地理, 2023, 43(6):202-210.
|
| [26] |
刘震, 杨勇. 互联网使用与家庭文旅消费——兼论互联网普及下居民消费升级的可行性[J]. 旅游学刊, 2022, 37(2):75-93.
|
| [27] |
许先普, 陈天鑫. 旅游消费、产业结构调整与区域均衡发展[J]. 消费经济, 2019, 35(2):25-33.
|
| [28] |
姜红. “双碳”目标驱动下旅游产业结构升级的技术路径与动力机制[J]. 旅游学刊, 2022, 37(5):10-12.
|
| [29] |
张晨, 左冰. 中国旅游业鲍莫尔成本病实证检验[J]. 旅游科学, 2021, 35(3):42-61.
|
| [30] |
孙根年, 幸迪. 2020—2022年COVID-19疫情对中国居民消费及消费结构的影响[J]. 地理学报, 2023, 78(4):894-912.
|
| [31] |
杨永恒, 胡鞍钢, 张宁. 中国人类发展的地区差距和不协调——历史视角下的“一个中国,四个世界”[J]. 经济学(季刊), 2006(2):803-816.
|
| [32] |
谢汝宗, 杨明婉, 白福臣. 数字普惠金融、居民消费与产业结构升级——基于广东省地级面板数据的PVAR动态分析[J]. 调研世界, 2022(2):59-70.
|
| [33] |
谢佳慧, 张良. 住房资产、住房负债与家庭旅游消费[J]. 旅游科学, 2018, 32(6):47-64.
|
| [34] |
陈劭锋, 马建新. 居民消费结构演变的国际比较分析[J]. 科技促进发展, 2017, 13(10):818-825.
|
/
| 〈 |
|
〉 |

