
Spatial-temporal Pattern of Ecological Well-Being Performance Level and Its Influencing Factors in Bohai Sea Rim Region
Received date: 2022-02-14
Revised date: 2023-06-20
Online published: 2024-09-12
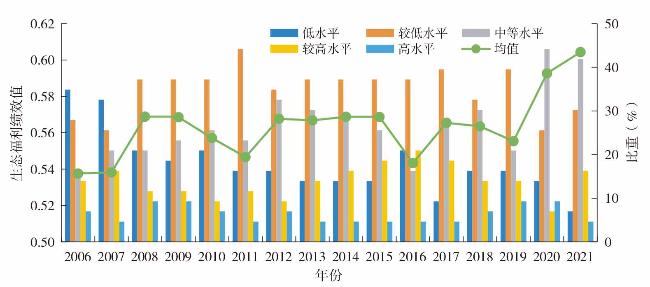
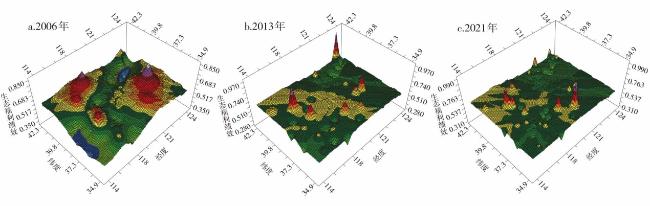
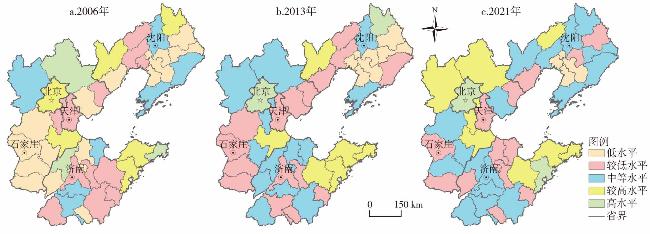
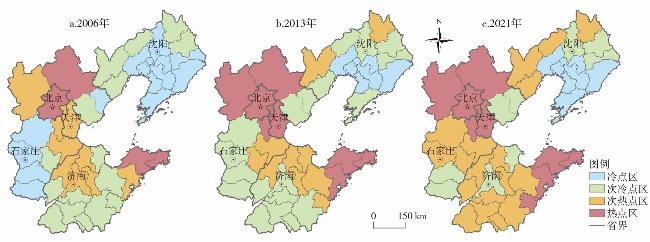
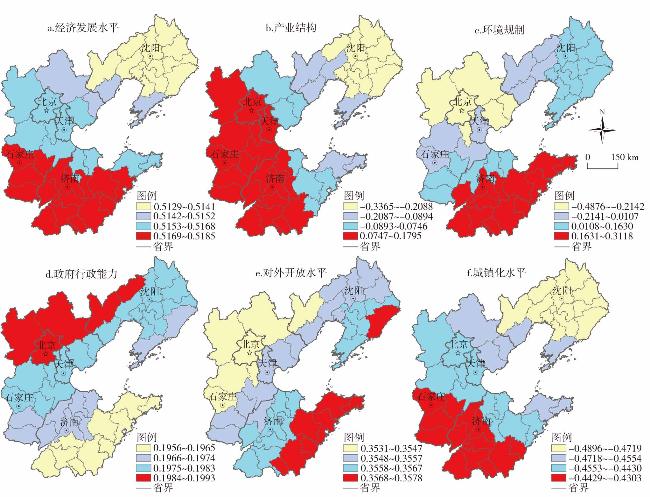
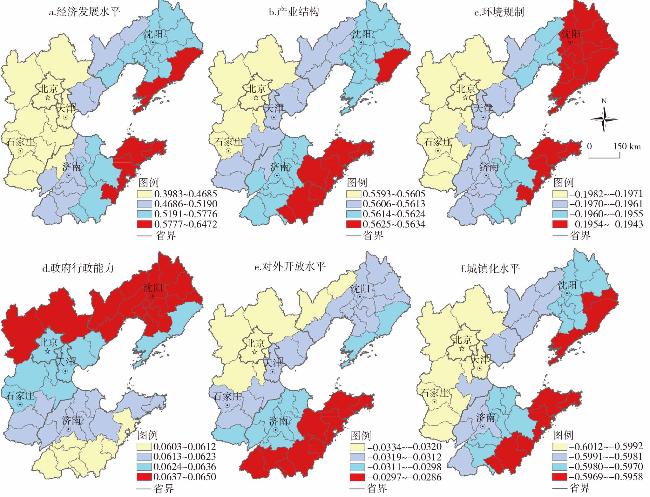
This paper constructs an evaluation index system of ecological well-being performance,uses the Super-EBM model to quantitatively measure the ecological well-being performance of the Bohai Sea Rim region from 2006 to 2021,and analyzes the spatial-temporal pattern of ecological well-being performance and its influencing factors by the means of the spatial variogram function,spatial autocorrelation analysis and MGWR model. The results show that: 1) The ecological well-being performance in the Bohai Sea Rim region shows a fluctuating upward trend from 2006 to 2021,the overall level of ecological well-being performance is low,the growth rate is extremely slow,and there is a decoupling problem with economic growth. 2) The spatial differentiation of ecological well-being performance in the Bohai Sea Rim region has experienced a process of decreasing and then increasing,with the largest spatial differences in the northeast-southwest direction. The Jiaodong Peninsula and Beijing are high-value distribution areas,and the low-value areas are distributed in the Mid-southern Liaoning urban agglomeration and the economic belt of southern Shandong Province. 3) There is a significant positive spatial autocorrelation in the ecological well-being performance of the Bohai Sea Rim,and the spatial autocorrelation tends to increase over time. The hotspots are distributed in Beijing-Tianjin and Jiaodong Peninsula and form a double-core structure,and the coldspots are contiguously distributed in Liaoning and southwest of Shandong. 4) There is significant spatial heterogeneity in the direction and intensity of the influences on ecological well-being performance. Economic development level and government administrative capacity have positive effects on the ecological well-being performance,industrial structure and opening-up level have significant stage characteristics,environmental regulation and urbanization level have a negative effect on the ecological well-being performance.
ZHAO Lin , CAO Naigang , GAO Xiaotong , HAN Zenglin . Spatial-temporal Pattern of Ecological Well-Being Performance Level and Its Influencing Factors in Bohai Sea Rim Region[J]. Economic geography, 2024 , 44(3) : 178 -188 . DOI: 10.15957/j.cnki.jjdl.2024.03.018
表1 环渤海地区生态福利绩效变差函数拟合参数Tab.1 The parameter of ecological well-being performance in Bohai Sea Rim region |
| 年份 | 拟合参数 | 分维数 | ||||||||
|---|---|---|---|---|---|---|---|---|---|---|
| 模型 | 块金值 | 基台值 | 块金系数 | 全方向 | 南—北 | 东北—西南 | 东—西 | 东南—西北 | ||
| 2006 | 指数 | 0.0155 | 0.0448 | 0.6539 | 1.825 | 1.839 | 1.827 | 1.807 | 1.783 | |
| 2013 | 球形 | 0.0012 | 0.0214 | 0.9463 | 1.946 | 1.990 | 1.956 | 1.852 | 1.835 | |
| 2021 | 指数 | 0.0033 | 0.0221 | 0.8534 | 1.835 | 1.740 | 1.736 | 1.798 | 1.887 | |
表2 环渤海地区生态福利绩效全局莫兰值变化趋势Tab.2 Moran's I value change trend of ecological well-being performance in Bohai Sea Rim region |
| 年份 | Moran's I | P值 | Z值 | 年份 | Moran's I | P值 | Z值 |
|---|---|---|---|---|---|---|---|
| 2006 | 0.097 | 0.098 | 1.066 | 2014 | 0.246 | 0.011 | 2.550 |
| 2007 | 0.141 | 0.063 | 1.547 | 2015 | 0.211 | 0.024 | 2.171 |
| 2008 | 0.156 | 0.053 | 1.705 | 2016 | 0.253 | 0.006 | 2.569 |
| 2009 | 0.142 | 0.068 | 1.545 | 2017 | 0.277 | 0.005 | 2.953 |
| 2010 | 0.171 | 0.056 | 1.773 | 2018 | 0.230 | 0.020 | 2.415 |
| 2011 | 0.242 | 0.014 | 2.469 | 2019 | 0.241 | 0.020 | 2.430 |
| 2012 | 0.223 | 0.011 | 2.352 | 2020 | 0.289 | 0.007 | 2.944 |
| 2013 | 0.133 | 0.068 | 1.499 | 2021 | 0.201 | 0.017 | 2.151 |
| [1] |
曲衍波, 王霞, 王世磊, 等. 环渤海地区城市规模扩张与质量增长的时空演变及耦合特征[J]. 地理研究, 2021, 40(3):762-778.
|
| [2] |
贾建琦, 赵林, 高晓彤, 等. 环渤海地区包容性绿色增长效率的空间关联网络结构及其影响因素[J]. 地理与地理信息科学, 2021, 37(5):46-54.
|
| [3] |
|
| [4] |
诸大建. 生态经济学:可持续发展的经济学和管理学[J]. 中国科学院院刊, 2008(6):520-530.
|
| [5] |
|
| [6] |
|
| [7] |
诸大建, 张帅. 生态福利绩效及其与经济增长的关系研究[J]. 中国人口·资源与环境, 2014, 24(9):59-67.
|
| [8] |
|
| [9] |
|
| [10] |
臧漫丹, 高易, 李金. 行政等级与城市规模对生态福利绩效的影响研究[J]. 自然资源学报, 2022, 37(12):3201-3216.
|
| [11] |
王兆峰, 王梓瑛. 长江经济带生态福利绩效空间格局演化及影响因素研究——基于超效率SBM模型[J]. 长江流域资源与环境, 2021, 30(12):2822-2832.
|
| [12] |
肖黎明, 张仙鹏. 强可持续理念下绿色创新效率与生态福利绩效耦合协调的时空特征[J]. 自然资源学报, 2019, 34(2):312-324.
|
| [13] |
徐维祥, 徐志雄, 刘程军. 黄河流域地级城市土地集约利用效率与生态福利绩效的耦合性分析[J]. 自然资源学报, 2021, 36(1):114-130.
|
| [14] |
龙亮军. 基于两阶段Super-NSBM模型的城市生态福利绩效评价研究[J]. 中国人口·资源与环境, 2019, 29(7):1-10.
|
| [15] |
|
| [16] |
朱媛媛, 张瑞, 顾江, 等. “双碳”目标下长江中游城市群生态福利绩效变化的经济——环境效应[J]. 经济地理, 2023, 43(5):89-96.
|
| [17] |
|
| [18] |
赵林, 曹乃刚, 韩增林, 等. 中国生态福利绩效空间关联网络演变特征与形成机制[J]. 自然资源学报, 2022, 37(12):3183-3200.
|
| [19] |
方时姣, 肖权. 中国区域生态福利绩效水平及其空间效应研究[J]. 中国人口·资源与环境, 2019, 29(3):1-10.
|
| [20] |
郭炳南, 唐利, 张浩. 环境规制与长江经济带生态福利绩效的空间效应研究[J]. 经济体制改革, 2021(3):73-79.
|
| [21] |
肖黎明, 肖沁霖. 黄河流域城市生态福利绩效格局分异及空间收敛分析[J]. 软科学, 2021, 35(2):46-53.
|
| [22] |
王喜平, 罗金芳. 京津冀生态福利绩效及时空演变研究[J]. 科技管理研究, 2020, 40(21):249-255.
|
| [23] |
龙亮军, 王霞, 郭兵. 基于改进DEA模型的城市生态福利绩效评价研究——以我国35个大中城市为例[J]. 自然资源学报, 2017, 32(4):595-605.
|
| [24] |
王圣云, 段练成. 中国生态福利绩效时空格局演变及其驱动效应分析[J]. 地理科学进展, 2023, 42(4):617-628.
|
| [25] |
林木西, 耿蕊, 李国柱. 省域生态福利绩效水平的空间非均衡性研究——基于MLD指数与分布动态学模型[J]. 东岳论丛, 2019, 40(10):73-83.
|
| [26] |
|
| [27] |
李成宇, 张士强, 张伟, 等. 中国省际生态福利绩效测算及影响因素研究[J]. 地理科学, 2019, 39(12):1875-1883.
|
| [28] |
邓远建, 杨旭, 马强文, 等. 中国生态福利绩效水平的地区差距及收敛性[J]. 中国人口·资源与环境, 2021, 31(4):132-143.
|
| [29] |
郭炳南, 林基, 刘堂发. 环境规制对长三角地区城市生态福利绩效的影响[J]. 统计与决策, 2021, 37(4):15-18.
|
| [30] |
董洁芳, 张凯莉, 屈学书, 等. 黄河流域城市生态福利绩效测算及驱动因素研究[J]. 干旱区地理, 2023, 46(3):1-14.
|
| [31] |
|
| [32] |
|
| [33] |
王凯, 邹楠, 甘畅. 旅游技术效率、旅游绿色生产率收敛性及其影响因素[J]. 经济地理, 2022, 42(6):215-224.
|
| [34] |
陈延斌, 殷冠文, 王少慧. 山东省电子商务发展水平的地域特征及影响因素[J]. 经济地理, 2022, 42(1):135-143.
|
| [35] |
|
| [36] |
|
/
| 〈 |
|
〉 |