
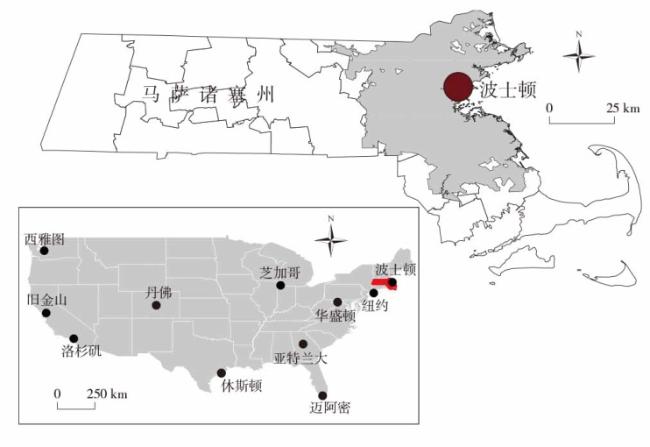
Spatio-temporal Characteristics of Global Sport Linkage Networks and Their Influencing Factors:Based on the Boston Marathon
Received date: 2023-09-13
Revised date: 2024-02-10
Online published: 2024-09-12
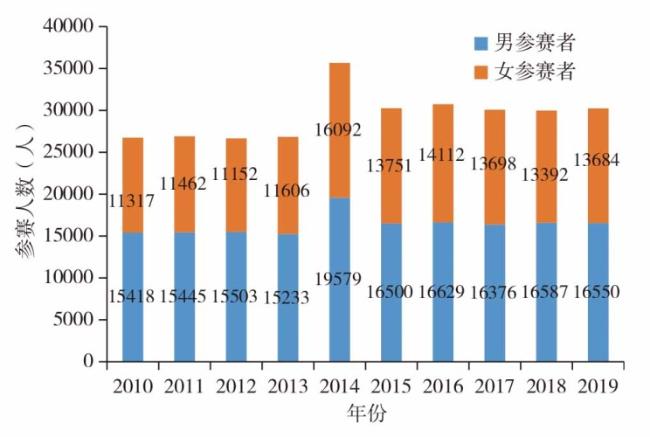
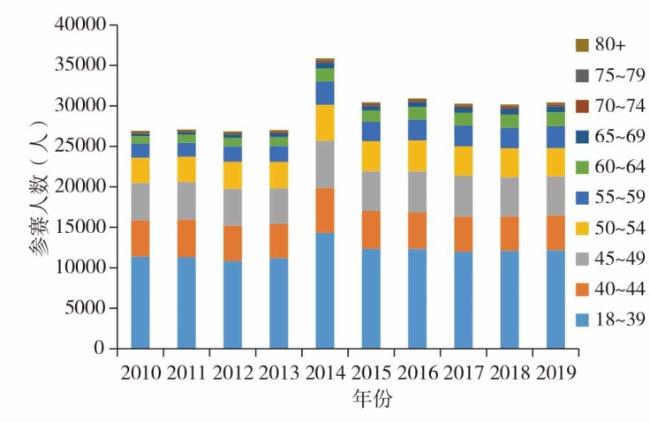
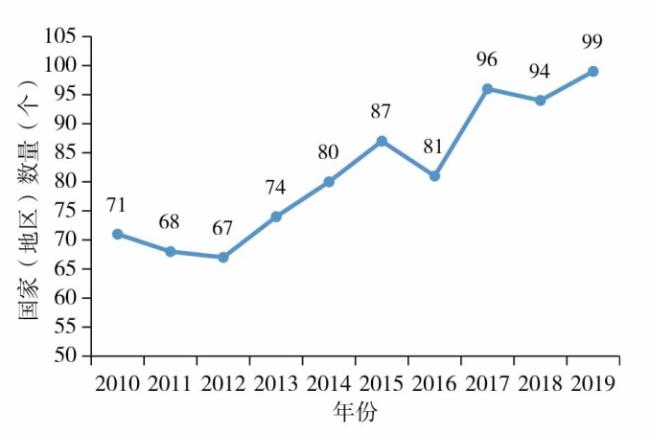
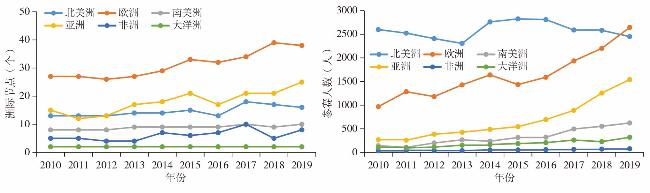
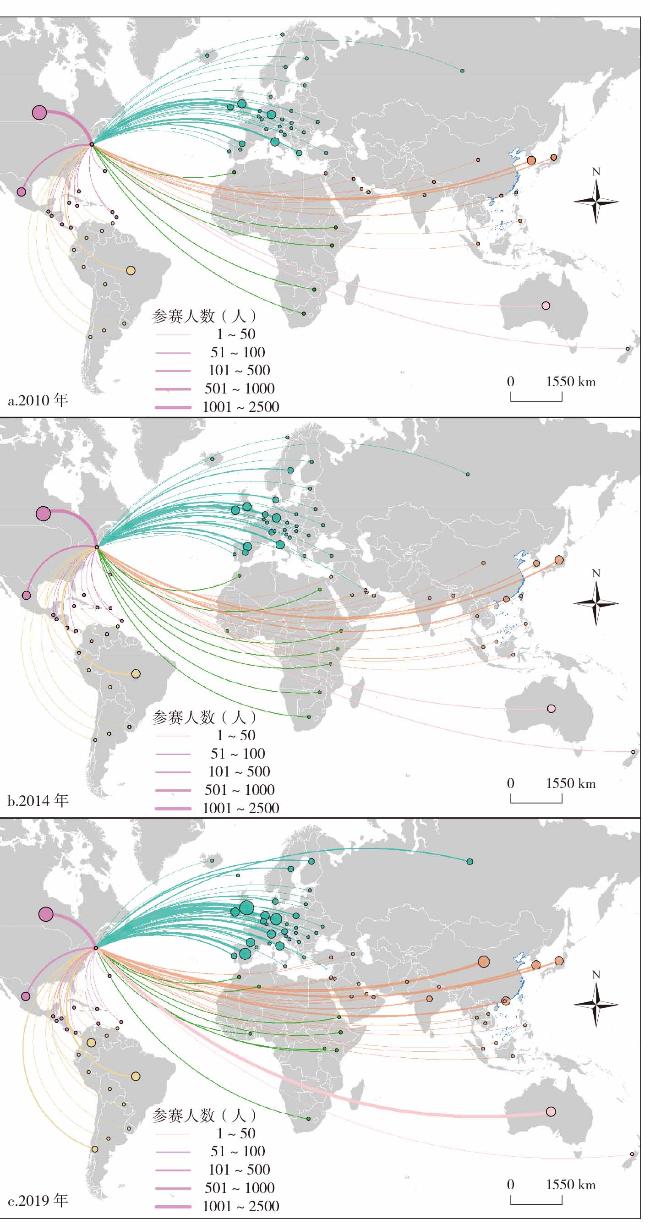
In order to explore the spatio-temporal characteristics of urban global linkage networks of sports events,it applies the methods of social network analysis and spatial analysis to study the characteristics of the spatio-temporal evolution of the global sport linkage networks and their influencing factors based on the data of Boston Marathon participants in 2010-2019. The results show that: 1) The number of countries (regions) from which Boston Marathon participants came increased from 71 in 2010 to 99 in 2019,and the number of participants increased from 26000 to 30000,with a fluctuating upward trend in the network size. 2) The density of the global sport linkage network of Boston Marathon became larger (0.551→0.787),the weighted average degree increased (32.41→60.31),network heterogeneity decreases (0.497→0.415). 3) Nodes of the global sport linkage network are mainly distributed in Europe and the Americas,followed by Asia,Africa is less,Oceania is unchanged. 4) The global sport linkage network of Boston Marathon with countries(regions) has generally increased,especially Canada,Mexico and Europe,followed by Asia. Africa's connection with Boston is increasing slightly. 5) Globalization level, economic factors,cultural factors,social factors,and transportation factors are the main factors influencing the spatial-temporal evolution of the global sport linkage network in Boston.
CHEN Kunlun , ZHAO Jie , HE Lina , ZHANG Xu , NIU Di . Spatio-temporal Characteristics of Global Sport Linkage Networks and Their Influencing Factors:Based on the Boston Marathon[J]. Economic geography, 2024 , 44(3) : 76 -85 . DOI: 10.15957/j.cnki.jjdl.2024.03.008
表1 2010—2019年波士顿全球体育联系网络特征变化Tab.1 Characteristics of Boston global sport linkage network during 2010 and 2019 |
| 年份 | 规模(个) | 联系边(条) | 网络密度 | 平均加权度 | 网络异质性 |
|---|---|---|---|---|---|
| 2010 | 71 | 70 | 0.551 | 32.409 | 0.497 |
| 2011 | 68 | 67 | 0.528 | 33.953 | 0.499 |
| 2012 | 67 | 66 | 0.520 | 34.055 | 0.500 |
| 2013 | 74 | 73 | 0.575 | 36.346 | 0.494 |
| 2014 | 80 | 79 | 0.622 | 42.079 | 0.485 |
| 2015 | 86 | 85 | 0.677 | 42.709 | 0.468 |
| 2016 | 81 | 80 | 0.630 | 44.724 | 0.483 |
| 2017 | 96 | 95 | 0.748 | 49.094 | 0.434 |
| 2018 | 94 | 93 | 0.740 | 54.268 | 0.438 |
| 2019 | 99 | 98 | 0.787 | 60.307 | 0.415 |
表2 2010—2019年波马参赛者来源的发达国家和发展中国家节点度与参赛人数Tab.2 Node degree of developed and developing countries from which Boston Marathon participants come and number of participants during 2010 and 2019 |
| 年份 | 发达国家 | 发展中国家 | |||||||
|---|---|---|---|---|---|---|---|---|---|
| 节点度 (个) | 占比 (%) | 参赛 人数(人) | 占比 (%) | 节点度 (个) | 占比 (%) | 参赛 人数(个) | 占比 (%) | ||
| 2010 | 30 | 42.86 | 3690 | 89.65 | 40 | 57.14 | 426 | 10.35 | |
| 2011 | 31 | 46.27 | 3883 | 89.86 | 36 | 54.73 | 429 | 10.14 | |
| 2012 | 30 | 45.45 | 3757 | 86.89 | 36 | 54.55 | 567 | 10.11 | |
| 2013 | 32 | 43.84 | 3879 | 84.03 | 41 | 56.16 | 737 | 15.97 | |
| 2014 | 30 | 40.54 | 4521 | 84.59 | 44 | 60.46 | 823 | 15.41 | |
| 2015 | 33 | 38.37 | 4304 | 78.94 | 53 | 61.63 | 1120 | 21.06 | |
| 2016 | 32 | 40.00 | 4521 | 79.56 | 48 | 60.00 | 1159 | 20.44 | |
| 2017 | 33 | 34.74 | 4580 | 73.46 | 62 | 65.26 | 1655 | 26.54 | |
| 2018 | 33 | 35.48 | 4822 | 69.98 | 60 | 64.52 | 2068 | 30.02 | |
| 2019 | 34 | 34.34 | 5198 | 67.89 | 65 | 65.66 | 2458 | 32.11 | |
表3 2010—2019年参赛者数量与全球化水平相关性分析Tab.3 Correlation analysis between the number of participants and the globalization level in 2010-2019 |
| 2019 | 2018 | 2017 | 2016 | 2015 | 2014 | 2013 | 2012 | 2011 | 2010 | |
|---|---|---|---|---|---|---|---|---|---|---|
| Pearson相关性 | 0.474** | 0.415** | 0.607** | 0.663** | 0.473** | 0.432** | 0.380** | 0.542** | 0.325** | 0.378** |
| 显著性(双尾) | 0.000 | 0.000 | 0.000 | 0.000 | 0.000 | 0.000 | 0.000 | 0.000 | 0.000 | 0.000 |
表4 2010—2019年参赛者数量与经济水平相关性分析Tab.4 Correlation analysis between the number of participants and the economic level in 2010-2019 |
| 2019 | 2018 | 2017 | 2016 | 2015 | 2014 | 2013 | 2012 | 2011 | 2010 | |
|---|---|---|---|---|---|---|---|---|---|---|
| Pearson相关性 | 0.677** | 0.697** | 0.638** | 0.576** | 0.506** | 0.523** | 0.564** | 0.539** | 0.532** | 0.568** |
| 显著性(双尾) | 0.000 | 0.000 | 0.000 | 0.000 | 0.000 | 0.000 | 0.000 | 0.000 | 0.000 | 0.000 |
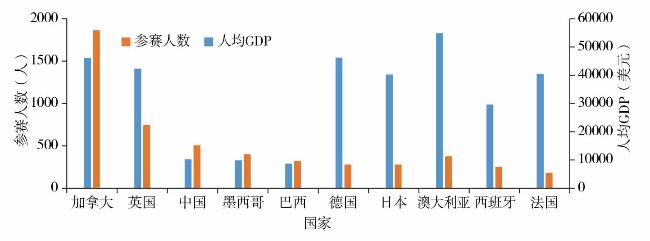
图8 2019年国家人均GDP与波马参赛人数注:数据来自于世界银行数据库(http://data.uis.unesco.org/Index.aspx#)。 Fig.8 National per capita GDP and Boston Marathon participants in 2019 |
表5 2010—2019年参赛者数量与文化因素相关性分析Tab.5 Correlation analysis between the number of participants and the cultural factors in 2010-2019 |
| 2019 | 2018 | 2017 | 2016 | 2015 | 2014 | 2013 | 2012 | 2011 | 2010 | |
|---|---|---|---|---|---|---|---|---|---|---|
| Pearson相关性 | 0.472** | 0.494** | 0.531** | 0.564** | 0.583** | 0.561** | 0.556** | 0.542** | 0.593** | 0.598** |
| 显著性(双尾) | 0.000 | 0.000 | 0.000 | 0.000 | 0.000 | 0.000 | 0.000 | 0.000 | 0.000 | 0.000 |
表6 2010—2019年参赛人数与交通水平相关性分析Tab.6 Correlation analysis between the number of participants and the traffic level in 2010-2019 |
| 2019 | 2018 | 2017 | 2016 | 2015 | 2014 | 2013 | 2012 | 2011 | 2010 | |
|---|---|---|---|---|---|---|---|---|---|---|
| Pearson相关性 | 0.642** | 0.662** | 0.593** | 0.521** | 0.472** | 0.402** | 0.452** | 0.433** | 0.451** | 0.458** |
| 显著性(双尾) | 0.000 | 0.000 | 0.000 | 0.000 | 0.000 | 0.000 | 0.000 | 0.000 | 0.000 | 0.000 |
| [1] |
|
| [2] |
丁一, 戴健. 伦敦建设全球著名体育城市的指标维度分析与启示[J]. 上海体育学院学报, 2019, 43(1):65-71.
|
| [3] |
上海市人民政府. 上海全球著名体育城市建设纲要[EB/OL]. https://www.shanghai.gov.cn/nw12344/20201104/29ae95eb451e49ca850b71e4be1ee0d7.html,2020-11-04.
|
| [4] |
王邵励. 板球运动的传播及其在地境遇:体育全球史的视角[J]. 体育科学, 2020, 40(4):90-97.
|
| [5] |
马秀梅. “体育全球化”起源时间的再考量[J]. 山东体育学院学报, 2019, 35(2):20-28.
|
| [6] |
|
| [7] |
陈晋. 体育全球化特征探析[J]. 山东体育科技, 2010, 32(1):39-41.
|
| [8] |
|
| [9] |
|
| [10] |
李恩康, 陆玉麒, 杨星, 等. 全球城市网络联系强度的时空演化研究——基于2014-2018年航空客运数据[J]. 地理科学, 2020, 40(1):32-39.
|
| [11] |
王列辉, 林羽珊,
|
| [12] |
高菠阳, 李俊玮. 全球电子信息产业贸易网络演化特征研究[J]. 世界地理研究, 2017, 26(1):1-11.
|
| [13] |
杨文龙, 杜德斌, 游小珺, 等. 世界跨国投资网络结构演化及复杂性研究[J]. 地理科学, 2017, 37(9):1300-1309.
|
| [14] |
侯纯光, 杜德斌, 刘承良, 等. 全球留学生留学网络时空演化及其影响因素[J]. 地理学报, 2020, 75(4):681-694.
|
| [15] |
刘承良, 桂钦昌, 段德忠, 等. 全球科研论文合作网络的结构异质性及其邻近性机理[J]. 地理学报, 2017, 72(4):737-752.
|
| [16] |
曹湛, 戴靓, 吴康, 等. 全球城市知识合作网络演化的结构特征与驱动因素[J]. 地理研究, 2022, 41(4):1072-1091.
|
| [17] |
桂钦昌, 杜德斌, 刘承良, 等. 全球城市知识流动网络的结构特征与影响因素[J]. 地理研究, 2021, 40(5):1320-1337.
|
| [18] |
|
| [19] |
|
| [20] |
张晓琳. 波士顿马拉松文化溯源与启示[J]. 北京体育大学学报, 2020, 43(4):134-141.
|
| [21] |
胡奎娟. 世界马拉松大满贯赛事特点及启示[J]. 南京体育学院学报, 2018, 1(10):14-19.
|
| [22] |
刘昌亚, 朱卫东, 邰崇禧, 等. 波士顿马拉松赛及其启示[J]. 体育文化导刊, 2017(5):64-68.
|
| [23] |
刘望保, 韩茂凡, 谢智豪. 全球航线数据下世界城市网络的连接性特征与社团识别[J]. 经济地理, 2020, 40(1):34-40,49.
|
| [24] |
刘军. 整体网分析讲义:UCINET软件实用指南[M]. 上海人民出版社, 2009.
|
| [25] |
陈昆仑, 林晨喧, 刘小琼, 等. 中国马拉松网络关注的时空特征及影响因素[J]. 经济地理, 2022, 42(1):117-126.
|
| [26] |
杨梅, 陆志勇. 马拉松赛事“四力”传播效应对赛事核心竞争力的影响研究[J]. 中国体育科技, 2020, 56(6):46-55.
|
| [27] |
陈昆仑, 郭宇琪, 许红梅, 等. 中国高水平马拉松赛事的空间分布特征及影响因素[J]. 上海体育学院学报, 2018, 42(6):36-41.
|
| [28] |
王立, 邱川曦, 薛德升. 世界城市全球化空间的演变与重塑模式——以柏林波茨坦广场为例[J]. 人文地理, 2019, 34(3):75-82.
|
| [29] |
范可. 体育人类学——何以可能何以可为[J]. 广州体育学院学报, 2020, 40(1):1-8.
|
| [30] |
于显洋, 林超. “马拉松热”的社会学隐喻[J]. 体育学研究, 2018, 1(5):61-68.
|
| [31] |
|
| [32] |
王健. 跑步健身中的身体管理与理性化——一项基于马拉松跑者的质性考察[J]. 体育科学, 2019, 39(12):34-42.
|
| [33] |
|
| [34] |
|
| [35] |
|
| [36] |
欧钰斌, 薛德升. 亚洲城市承办奥运会时的跨城联系异同——基于北京和东京夏季奥运会的比较研究[J]. 人文地理, 2022, 37(6):98-108.
|
| [37] |
欧钰斌, 黄耿志, 薛德升. 体育赛事视角下的世界城市网络结构特征——基于国际网球巡回赛的研究[J]. 世界地理研究, 2023, 32(9):1-16.
|
/
| 〈 |
|
〉 |