
Coupling Coordination Between Digital Economy and Tourism High-quality Development at the Provincial Level and Its Driving Factors
Received date: 2023-06-09
Revised date: 2023-11-10
Online published: 2024-06-03
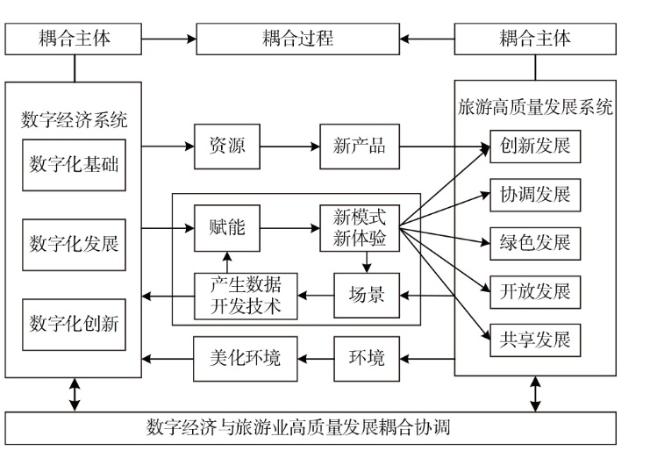
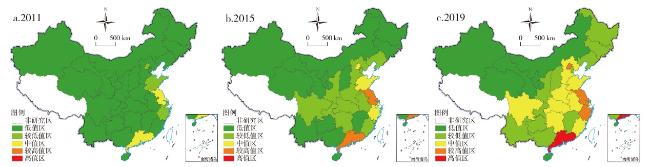
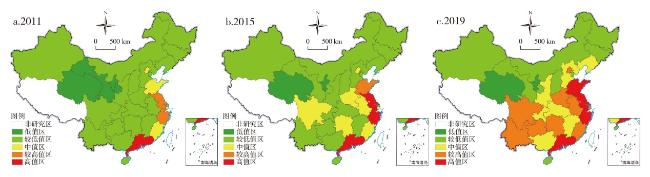
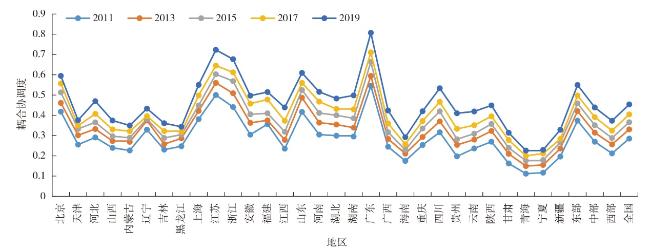
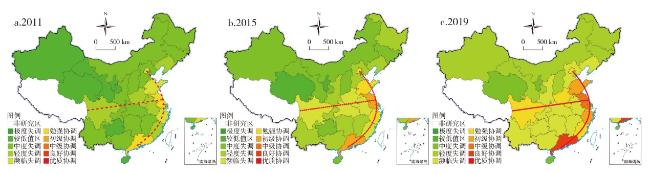
The digital economy empowers the tourism high-quality development,the tourism high-quality development forces and drives the release of new dynamics of the digital economy. Based on the panel data of 30 provincial-level regions of China in 2011-2019,this study sorts out the coupling mechanism between digital economy and tourism high-quality development,and explores the coupling coordination evolutionary of digital economy and tourism high-quality development by the means of the coupling coordination degree. It uses the methods of the obstacle degree model and panel Tobit model to diagnose the obstacle factors and analyze the external influencing factors of the two systems,respectively. It's found that: 1) From 2011 to 2019,the comprehensive evaluation indexes of digital economy and tourism high-quality development both show dynamic growth in general,and both change from the "higher in coastal region and lower in central and western regions" distribution to "higher in the middle region and lower in the north and south of China" distribution. 2) From 2011 to 2019,the overall coordination degree between tourism high-quality development and digital economy tends to be optimized,but it has the gap to reach the high-quality coordination,and the spatial distribution pattern of coupling coordination degree shows dynamic evolution which is from the "higher in eastern region,lower in western region and T-shaped" distribution characteristics,"lower in the north and south of China and T-shaped " distribution characteristics to "lower in the north and south of China,higher in the middle region and T-shaped" distribution characteristics. 3) Most provincial-level regions have the same obstacle factors in the top three indicator layers of two subsystems,the rank of obstacle degrees from high value to low value is digital innovation,digital development and digital foundation respectively in the central and western regions,the middle zone and the north and south of China. In the eastern region and the "T-shaped" zone,the rank of obstacle degrees from high value to low value is digital development,digital innovation and digital foundation. 4) The level of economic development,industrial structure,traffic accessibility,openness to the outside world,and education level positively influence the coordinated development of the two systems,while the urbanization process negatively influences the development of the two systems,the rank of the regression coefficients of all influencing factors from high value to low value is the eastern region,the central region,the western region,the T-shaped zone,the middle zone,the north and south of China.
SHU Xiaolin , MIN Zhesi , GUO Xiangyang , HE Yalan , ZHANG Qianxi . Coupling Coordination Between Digital Economy and Tourism High-quality Development at the Provincial Level and Its Driving Factors[J]. Economic geography, 2024 , 44(1) : 197 -208 . DOI: 10.15957/j.cnki.jjdl.2024.01.020
表1 数字经济发展水平和旅游业高质量水平的评价指标体系及权重表Tab.1 Evaluation index system and weighting of digital economy development level and tourism high-quality development level |
| 系统层 | 准则层 | 要素层 | 指标(权重/属性) | 指标衡量方法(单位) |
|---|---|---|---|---|
| 数 字 经 济 发 展 水 平 | 数 字 化 基 础 | 信息化基础 | X1光缆设施(0.029/+) | 光缆线路长度(km) |
| X2移动电话交换机(0.021/+) | 移动电话交换机容量(万户) | |||
| X3信息化从业人员(0.050/+) | 信息传输、软件和信息技术服务业从业人员(万人) | |||
| 互联网基础 | X4域名数(0.071/+) | 互联网域名数(万个) | ||
| X5互联网宽带接入端口(0.029/+) | 互联网宽带接入端口(万个) | |||
| X6移动电话普及率(0.013/+) | 百人中移动电话用户数(部/百人) | |||
| X7互联网上网人数(0.024/+) | 互联网上网人数(万人) | |||
| 数 字 化 发 展 | 信息业务 | X8电信业务总量(0.052/+) | 电信业务总量(亿元) | |
| X9软件业务收入(0.083/+) | 软件业务收入(亿元) | |||
| 移动能力 | X10网上支付水平(0.014/+) | 网上移动支付水平(万元) | ||
| X11快递业务收入(0.093/+) | 快递业务收入(万元) | |||
| 数字金融 | X12数字惠普金融覆盖广度(0.105/+) | 数字惠普金融覆盖广度指数(-) | ||
| X13数字惠普金融使用深度(0.011/+) | 数字惠普金融使用深度指数(-) | |||
| X14数字惠普金融数字化程度(0.014/+) | 数字惠普金融数字化程度指数(-) | |||
| 数 字 化 创 新 | 创新投入 | X15 R&D经费(0.056/+) | 规模以上工业企业R&D经费支出(万元) | |
| X16 R&D人员全时当量(0.058/+) | 规模以上工业企业R&D人员折合全时当量(人年) | |||
| X17新产品开发经费支出(0.064/+) | 新产品开发经费支出(万元) | |||
| 创新产出 | X18技术市场成交额(0.091/+) | 技术市场成交额(万元) | ||
| X19专利申请授权数(0.063/+) | 专利申请授权数(件) | |||
| X20新产品销售收入(0.061/+) | 新产品销售收入(万元) | |||
| 旅 游 业 高 质 量 发 展 水 平 | 创 新 发 展 | 创新驱动 | Y1旅游R&D经费(0.069/+) | R&D经费总数额×[旅游业产值占GDP的比值](万元) |
| Y2旅游发明专利(0.084/+) | 旅游相关的发明专利授权数(个) | |||
| 人力资本 | Y3旅游劳动生产率(0.032/+) | 旅游业总收入/旅游业从业人员(万元/人) | ||
| Y4旅游学生数量(0.010/+) | 高等旅游院校和中等职业学校在校人数(人) | |||
| Y5旅游从业人员(0.035/+) | 星级饭店、旅行社、旅游景区的总人数(人) | |||
| 协 调 发 展 | 内部发展 | Y6旅游产业聚集度(0.027/+) | 相应省(自治区、直辖市)旅游收入占GDP比重与中国旅游收入占GDP比重的比值(-) | |
| Y7旅游产业地位(0.027/+) | 旅游收入与GDP总值的比值(-) | |||
| Y8旅游业增长弹性系数(0.002/+) | 旅游收入增长率与地区GDP增长率的比值(-) | |||
| 外部协调 | Y9旅游业与城市化协调(0.012/+) | 旅游业系统与城市化系统的耦合协调度(-) | ||
| Y10旅游业与经济协调(0.014/+) | 旅游业系统与经济系统的耦合协调度(-) | |||
| Y11旅游业与生态环境协调(0.014/+) | 旅游业系统与生态环境系统的耦合协调度(-) | |||
| 绿 色 发 展 | 生态质量 | Y12森林覆盖率(0.028/+) | 森林覆盖率(%) | |
| Y13公园绿地面积(0.015/+) | 人均公园绿地面积(m2) | |||
| Y14建成区绿化覆盖(0.007/+) | 建成区绿化覆盖率(%) | |||
| 环境治理 | Y15城市污水处理(0.043/+) | 城市污水处理率(%) | ||
| Y16生活垃圾处理(0.005/+) | 生活垃圾无害化处理率(%) | |||
| 污染排放 | Y17旅游碳排放量(0.003/-) | 旅游交通、旅游住宿及旅游活动产生的碳排放总量(万t) | ||
| 开 放 发 展 | 文旅传播 | Y18旅游资源丰度(0.032/+) | A级景区得分(-) | |
| Y19图书出版情况(0.033/+) | 图书出版总印数(万册) | |||
| Y20旅游企业数量(0.027/+) | 旅行社和饭店数量的总和(个) | |||
| Y21公共文化设施(0.026/+) | 公共图书馆数量、博物馆数量与文化馆机构数总和(个) | |||
| 对外交流 | Y22入境游客占比(0.131/+) | 入境游客数量/游客总量(%) | ||
| Y23旅游外汇占比(0.048/+) | 旅游外汇收入/旅游总收入(%) | |||
| Y24入境过夜旅游者人均天花费(0.024/+) | 入境过夜旅游者人均每天花费(美元/人天) | |||
| 共 享 发 展 | 公共服务 | Y25客运量总计(0.046/+) | 公路、水运、民用航空客运量(万人) | |
| Y26公共服务支出(0.028/+) | 一般公共服务(万元) | |||
| Y27文化体育支出(0.030/+) | 文化体育与传媒(万元) | |||
| 民生共享 | Y28每万人拥有公厕(0.018/+) | 每万人拥有公共厕所(个) | ||
| Y29人均旅游收入(0.034/+) | 旅游总收入/总人口(万元/人) | |||
| Y30艺术表演场馆演出场次(0.095/+) | 艺术表演场馆演出场次(万场次) |
表2 数字经济和旅游业高质量发展协调度等级划分表Tab.2 Classification of the coordination degree between digital economy and tourism high-quality development |
| 发展阶段 | 耦合协调度 | 耦合协调等级 | 取值区间 |
|---|---|---|---|
| 失调阶段 | [0.0,0.1) | 极度失调 | 0 D<0.4 |
| [0.1,0.2) | 严重失调 | ||
| [0.2,0.3) | 中度失调 | ||
| [0.3,0.4) | 轻度失调 | ||
| 过渡阶段 | [0.4,0.5) | 濒临失调 | 0.4 D<0.6 |
| [0.5,0.6) | 勉强协调 | ||
| 协调阶段 | [0.6,0.7) | 初级协调 | 0.6 D≤1.0 |
| [0.7,0.8) | 中级协调 | ||
| [0.8,0.9) | 良好协调 | ||
| [0.9,1.0] | 优质协调 |
表3 中国省域数字经济与旅游业高质量发展主要障碍因子及障碍度Tab.3 Main obstacle factors of digital economy and tourism high-quality development in China and their obstacle degree |
| 省域 | 数字经济系统 | 旅游业高质量发展系统 | |||||
|---|---|---|---|---|---|---|---|
| 第一障碍因子 (障碍度(%)) | 第二障碍因子 (障碍度(%)) | 第三障碍因子 (障碍度(%)) | 第一障碍因子 (障碍度(%)) | 第二障碍因子 (障碍度(%)) | 第三障碍因子 (障碍度(%)) | ||
| 北京 | X12(14.11) | X11(11.33) | X17(7.97) | Y22(17.32) | Y30(12.51) | Y2(8.44) | |
| 天津 | X12(11.20) | X11(9.85) | X18(8.98) | Y22(15.24) | Y30(11.08) | Y2(9.08) | |
| 河北 | X12(11.59) | X18(9.93) | X11(9.92) | Y22(16.19) | Y30(10.38) | Y2(9.91) | |
| 山西 | X12(10.97) | X11(9.79) | X18(9.49) | Y22(15.49) | Y30(10.10) | Y2(9.82) | |
| 内蒙古 | X12(11.90) | X11(9.71) | X18(9.45) | Y22(15.01) | Y30(10.93) | Y2(9.82) | |
| 辽宁 | X12(11.59) | X11(10.18) | X18(9.59) | Y22(16.25) | Y30(11.62) | Y2(10.11) | |
| 吉林 | X12(10.93) | X11(9.74) | X18(9.31) | Y22(15.08) | Y30(11.11) | Y2(9.61) | |
| 黑龙江 | X12(11.01) | X11(9.78) | X18(9.40) | Y22(15.06) | Y30(11.01) | Y2(9.23) | |
| 上海 | X12(12.81) | X18(9.66) | X11(7.74) | Y22(16.45) | Y30(11.92) | Y2(7.88) | |
| 江苏 | X12(16.50) | X18(12.56) | X11(12.30) | Y22(21.43) | Y30(13.59) | Y2(6.41) | |
| 浙江 | X12(14.46) | X18(12.01) | X11(9.72) | Y22(20.76) | Y30(9.42) | Y1(6.26) | |
| 安徽 | X12(11.61) | X11(10.12) | X18(9.77) | Y22(17.77) | Y2(9.69) | Y1(7.47) | |
| 福建 | X12(12.15) | X18(10.53) | X11(10.23) | Y22(16.48) | Y30(10.04) | Y2(9.55) | |
| 江西 | X12(11.13) | X11(9.83) | X18(9.60) | Y22(16.05) | Y30(11.00) | Y2(9.98) | |
| 山东 | X12(13.55) | X11(11.36) | X18(10.92) | Y22(19.32) | Y30(11.82) | Y2(9.14) | |
| 河南 | X12(11.85) | X18(10.21) | X11(10.20) | Y22(17.34) | Y2(9.96) | Y1(7.63) | |
| 湖北 | X12(11.85) | X11(10.24) | X18(8.98) | Y22(16.43) | Y30(10.58) | Y2(9.83) | |
| 湖南 | X12(11.59) | X11(10.18) | X18(9.83) | Y22(16.90) | Y30(10.67) | Y2(9.87) | |
| 广东 | X12(22.05) | X18(15.58) | X11(8.81) | Y22(16.67) | Y30(16.13) | Y2(7.82) | |
| 广西 | X12(11.03) | X11(9.77) | X18(9.59) | Y22(16.03) | Y30(11.75) | Y2(9.62) | |
| 海南 | X12(10.66) | X11(9.57) | X18(9.32) | Y22(12.62) | Y30(10.84) | Y2(9.31) | |
| 重庆 | X12(11.18) | X11(9.91) | X18(9.62) | Y22(15.56) | Y30(9.87) | Y2(8.89) | |
| 四川 | X12(12.09) | X11(10.37) | X18(9.76) | Y22(17.10) | Y30(11.07) | Y2(8.86) | |
| 贵州 | X12(10.88) | X11(9.70) | X18(9.39) | Y22(16.02) | Y30(11.48) | Y2(8.67) | |
| 云南 | X12(10.97) | X11(9.75) | X18(9.49) | Y22(16.01) | Y30(11.17) | Y2(10.22) | |
| 陕西 | X11(10.20) | X12(10.10) | X18(8.74) | Y22(16.08) | Y30(11.19) | Y2(9.49) | |
| 甘肃 | X12(10.77) | X11(9.65) | X18(9.19) | Y22(14.57) | Y30(10.21) | Y2(8.96) | |
| 青海 | X12(10.58) | X11(9.51) | X18(9.18) | Y22(13.77) | Y30(10.02) | Y2(8.84) | |
| 宁夏 | X12(10.59) | X11(9.53) | X18(9.26) | Y22(13.78) | Y30(9.97) | Y2(8.77) | |
| 新疆 | X12(10.80) | X11(9.66) | X18(9.43) | Y22(14.50) | Y30(10.63) | Y2(9.49) | |
表4 区域数字经济和旅游业高质量发展准则层障碍度Tab.4 Obstacle degree of digital economy and tourism high-quality development in different criterion layer by regions |
| 区域 | 时间 | 数字经济 | 旅游业高质量发展 | |||||||
|---|---|---|---|---|---|---|---|---|---|---|
| 数字化基础 | 数字化发展 | 数字化创新 | 创新发展 | 协调发展 | 绿色发展 | 开放发展 | 共享发展 | |||
| 东部 | 2011 | 0.2257 | 0.3931 | 0.3812 | 0.2457 | 0.0899 | 0.0778 | 0.3201 | 0.2666 | |
| 2015 | 0.2121 | 0.3990 | 0.3889 | 0.2227 | 0.0868 | 0.0743 | 0.3328 | 0.2834 | ||
| 2019 | 0.2112 | 0.3993 | 0.3895 | 0.1892 | 0.0857 | 0.0755 | 0.3630 | 0.2866 | ||
| 中部 | 2011 | 0.2279 | 0.3808 | 0.3912 | 0.2492 | 0.0914 | 0.0784 | 0.3238 | 0.2571 | |
| 2015 | 0.2195 | 0.3834 | 0.3972 | 0.2454 | 0.0856 | 0.0755 | 0.3383 | 0.2551 | ||
| 2019 | 0.2069 | 0.3858 | 0.4073 | 0.2335 | 0.0768 | 0.0777 | 0.3598 | 0.2523 | ||
| 西部 | 2011 | 0.2296 | 0.3753 | 0.3952 | 0.2454 | 0.0914 | 0.0830 | 0.3212 | 0.2590 | |
| 2015 | 0.2247 | 0.3729 | 0.4024 | 0.2423 | 0.0839 | 0.0809 | 0.3306 | 0.2622 | ||
| 2019 | 0.2152 | 0.3688 | 0.4160 | 0.2338 | 0.0677 | 0.0820 | 0.3516 | 0.2650 | ||
| “T字形”地带 | 2011 | 0.2232 | 0.3974 | 0.3794 | 0.2479 | 0.0909 | 0.0790 | 0.3211 | 0.2611 | |
| 2015 | 0.2045 | 0.4073 | 0.3881 | 0.2206 | 0.0878 | 0.0756 | 0.3358 | 0.2802 | ||
| 2019 | 0.2006 | 0.4096 | 0.3898 | 0.1777 | 0.0897 | 0.0758 | 0.3705 | 0.2862 | ||
| 中间地带 | 2011 | 0.2287 | 0.3788 | 0.3925 | 0.2470 | 0.0889 | 0.0769 | 0.3231 | 0.2641 | |
| 2015 | 0.2227 | 0.3791 | 0.3983 | 0.2413 | 0.0819 | 0.0756 | 0.3362 | 0.2651 | ||
| 2019 | 0.2121 | 0.3775 | 0.4103 | 0.2290 | 0.0669 | 0.0783 | 0.3619 | 0.2639 | ||
| 南北两端 | 2011 | 0.2307 | 0.3750 | 0.3943 | 0.2439 | 0.0930 | 0.0861 | 0.3194 | 0.2577 | |
| 2015 | 0.2277 | 0.3706 | 0.4017 | 0.2435 | 0.0863 | 0.0819 | 0.3277 | 0.2605 | ||
| 2019 | 0.2222 | 0.3672 | 0.4106 | 0.2417 | 0.0741 | 0.0827 | 0.3412 | 0.2604 | ||
| 全国 | 2011 | 0.2277 | 0.3831 | 0.3892 | 0.2468 | 0.0909 | 0.0797 | 0.3217 | 0.2609 | |
| 2015 | 0.2187 | 0.3851 | 0.3962 | 0.2368 | 0.0855 | 0.0769 | 0.3339 | 0.2669 | ||
| 2019 | 0.2111 | 0.3846 | 0.4043 | 0.2188 | 0.0767 | 0.0784 | 0.3581 | 0.2680 | ||
表5 耦合协调系统外部影响因素回归结果Tab.5 Regression results of external influences on the coupling coordination system |
| 地区 | lnPGDP | lnOPE | lnET | lnEL | lnIS | lnUR |
|---|---|---|---|---|---|---|
| 东部 | 0.2147***(11.46) | 0.0949***(12.89) | 0.1438***(11.73) | 0.0026(0.20) | 0.4028***(14.15) | -0.5139***(-9.34) |
| 中部 | 0.1791***(6.07) | 0.0542***(3.90) | 0.0489***(2.80) | 0.0834***(4.63) | 0.2129***(4.52) | -0.4191***(-4.76) |
| 西部 | 0.1095***(2.77) | 0.0140***(2.29) | 0.0489***(3.12) | 0.0522***(7.39) | 0.1105***(4.22) | -0.1118(-1.26) |
| “T字形”地带 | 0.1785***(6.92) | 0.0623***(4.41) | 0.1054***(10.09) | 0.0896***(5.52) | 0.2126***(4.98) | -0.1861*(-1.60) |
| 中间地带 | 0.1051***(4.04) | 0.0143*(1.92) | 0.0481***(4.10) | 0.0807***(6.45) | 0.1817***(7.38) | -0.1758***(-2.63) |
| 南北两端 | 0.0854***(6.43) | 0.0136***(3.16) | 0.0312***(5.49) | 0.0311***(8.12) | 0.1433***(10.30) | -0.0267(-0.79) |
| 全国 | 0.2067***(12.94) | 0.0580***(12.78) | 0.0826***(11.27) | 0.0376***(7.00) | 0.1869***(10.20) | -0.3237***(-8.11) |
注:***、**、*分别代表通过1%、5%、10%的显著性水平检验,括号内为Z值。 |
| [1] |
王兆峰, 谢佳亮, 吴卫. 环长株潭城市群旅游业高质量发展水平变化及其影响因素[J]. 经济地理, 2022, 42(3):172-181,221.
|
| [2] |
刘英基, 韩元军. 要素结构变动、制度环境与旅游经济高质量发展[J]. 旅游学刊, 2020, 35(3):28-38.
|
| [3] |
杨路明. 旅游电子商务理论及应用[M]. 北京: 化学工业出版社, 2015.
|
| [4] |
张旺, 白永秀. 数字经济与乡村振兴耦合的理论构建、实证分析及优化路径[J]. 中国软科学, 2022(1):132-146.
|
| [5] |
许宪春, 张美慧. 中国数字经济规模测算研究——基于国际比较的视角[J]. 中国工业经济, 2020(5):23-41.
|
| [6] |
|
| [7] |
|
| [8] |
王龙杰, 曾国军, 毕斗斗. 信息化对旅游产业发展的空间溢出效应[J]. 地理学报, 2019, 74(2):366-378.
|
| [9] |
王冠孝, 梁留科, 李锋, 等. 区域旅游业与信息化的耦合协调关系实证研究[J]. 自然资源学报, 2016, 31(8):1339-1350.
|
| [10] |
杨勇. 互联网促进旅游产业动态优化了吗?[J]. 经济管理, 2019, 41(5):156-170.
|
| [11] |
|
| [12] |
杨彦锋. 互联网技术成为旅游产业融合与新业态的主要驱动因素[J]. 旅游学刊, 2012, 27(9):7-8.
|
| [13] |
毛剑梅, 锁箭. 互联网背景下旅游产业的演化与发展:技术驱动视角[J]. 当代经济管理, 2017, 39(10):49-55.
|
| [14] |
|
| [15] |
戴克清, 苏振, 黄润. “互联网+”驱动中国旅游产业创新的效率研究[J]. 华东经济管理, 2019, 33(7):87-93.
|
| [16] |
周琳, 刘懿锋. 旅游产业与互联网融合发展研究[J]. 理论探讨, 2019(6):114-117.
|
| [17] |
赵磊. 数字经济赋能旅游业高质量发展的内涵与维度[J]. 旅游学刊, 2022, 37(4):5-6.
|
| [18] |
陈琳琳, 徐金海, 李勇坚. 数字技术赋能旅游业高质量发展的理论机理与路径探索[J]. 改革, 2022(2):101-110.
|
| [19] |
陈晓红. 数字经济时代的技术融合与应用创新趋势分析[J]. 中南大学学报:社会科学版, 2018, 24(5):1-8.
|
| [20] |
周锦, 王廷信. 数字经济下城市文化旅游融合发展模式和路径研究[J]. 江苏社会科学, 2021(5):70-77.
|
| [21] |
黄勃, 李海彤, 刘俊岐, 等. 数字技术创新与中国企业高质量发展——来自企业数字专利的证据[J]. 经济研究, 2023, 58(3):97-115.
|
| [22] |
乔向杰. 智慧旅游赋能旅游业高质量发展[J]. 旅游学刊, 2022, 37(2):10-12.
|
| [23] |
|
| [24] |
马斌斌, 豆媛媛, 贺舒琪, 等. 中国数字经济与旅游产业融合发展的时空特征及驱动机制[J]. 经济地理, 2023, 43(6):192-201.
|
| [25] |
唐睿. 长三角数字经济和旅游业高质量发展的空间特征分析[J]. 经济体制改革, 2022(5):51-59.
|
| [26] |
荆文君, 孙宝文. 数字经济促进经济高质量发展:一个理论分析框架[J]. 经济学家, 2019(2):66-73.
|
| [27] |
魏翔. 数字旅游——中国旅游经济发展新模式[J]. 旅游学刊, 2022, 37(4):10-11.
|
| [28] |
杨宏浩. 数字技术赋能旅游业高质量发展[J]. 中国旅游评论, 2020(3):59-64.
|
| [29] |
石培华, 吴普. 中国旅游业能源消耗与CO2排放量的初步估算[J]. 地理学报, 2011, 66(2):235-243.
|
| [30] |
余志康, 孙根年, 罗正文, 等. 40°N以北城市夏季气候舒适度及消夏旅游潜力分析[J]. 自然资源学报, 2015, 30(2):327-339.
|
| [31] |
任保平, 杜宇翔. 黄河流域经济增长—产业发展—生态环境的耦合协同关系[J]. 中国人口·资源与环境, 2021, 31(2):119-129.
|
| [32] |
舒小林, 高应蓓, 张元霞, 等. 旅游产业与生态文明城市耦合关系及协调发展研究[J]. 中国人口·资源与环境, 2015, 25(3):82-90.
|
| [33] |
陆利军, 李浪, 李成家, 等. 省域国家森林公园网络关注度与旅游吸引力动态耦合协调关系[J]. 经济地理, 2022, 42(3):150-159.
|
| [34] |
丁学谦, 吴群, 刘向南, 等. 土地利用、经济高质量发展与碳排放耦合协调度及影响因素——来自中国282个地级市的经验研究[J]. 资源科学, 2022, 44(11):2233-2246.
|
| [35] |
郭向阳, 穆学青, 明庆忠, 等. 长江经济带快速交通系统对城市旅游生产率的影响效应分析[J]. 经济地理, 2021, 41(12):213-222.
|
| [36] |
刘军, 杨渊鋆, 张三峰. 中国数字经济测度与驱动因素研究[J]. 上海经济研究, 2020(6):81-96.
|
/
| 〈 |
|
〉 |